DayPilot
Products
Support
DayPilot Code
JavaScript
Angular
React
Vue
ASP.NET
ASP.NET Core
PHP
Spring Boot
Open-Source
Resource Utilization Chart Tutorials
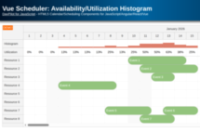
Vue Scheduler: Availability/Utilization Histogram
How to calculate resource utilization percentage and display a histogram at the top of the Vue Scheduler component.
vuejs
scheduler
utilization
availability
javascript
composition-api
vue3
Jun 22, 2026
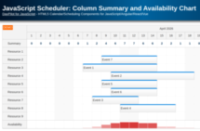
JavaScript Scheduler: Column Summary and Availability Chart
How to display a column summary with resource utilization and availability details in the JavaScript Scheduler component. The utilization is also displayed using a bar chart at the bottom of the Scheduler grid.
javascript
scheduler
frozen
utilization
availability
Apr 20, 2026
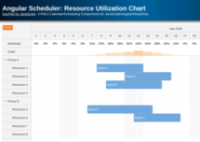
Angular Scheduler: Resource Utilization Chart
How to calculate resource utilization for time slots and show a bar chart in a fixed row displayed at the top of the Angular Scheduler component.
angular
angular21
scheduler
frozen
utilization
availability
typescript
Apr 14, 2026
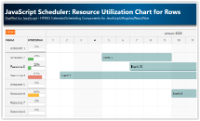
JavaScript Scheduler: Resource Utilization Chart for Rows
How to dynamically calculate the utilization percentage for each resource and display a chart with utilization details in the Scheduler row headers.
javascript
scheduler
utilization
availability
Mar 20, 2025
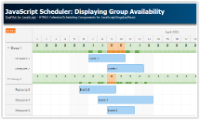
JavaScript Scheduler: Displaying Group Availability
How to show availability of child resources using color bars in the JavaScript Scheduler component.
javascript
scheduler
availability
utilization
Jun 25, 2024
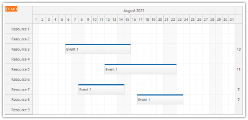
JavaScript Scheduler: How to Show Summary Columns on the Right
How to display a special column with summary data on the right side of the JavaScript Scheduler grid.
javascript
scheduler
summary
utilization
availability
Aug 11, 2021
Articles
1-6
of
6