Take a look at our collection of tutorials tailored to help you display availability in the Scheduler component. Covering Vue, Angular, and JavaScript, we'll guide you through creating histograms, bar charts, and color-coded displays to visually represent resource availability and utilization. So whether you want to show the availability of child resources or calculate resource utilization for time slots, we've got you covered.
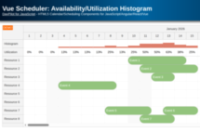
How to calculate resource utilization percentage and display a histogram at the top of the Vue Scheduler component.
Jun 22, 2026
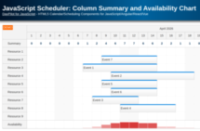
How to display a column summary with resource utilization and availability details in the JavaScript Scheduler component. The utilization is also displayed using a bar chart at the bottom of the Scheduler grid.
Apr 20, 2026
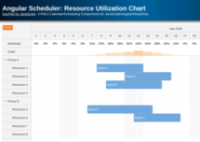
How to calculate resource utilization for time slots and show a bar chart in a fixed row displayed at the top of the Angular Scheduler component.
Apr 14, 2026
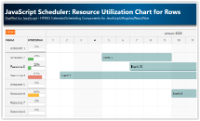
How to dynamically calculate the utilization percentage for each resource and display a chart with utilization details in the Scheduler row headers.
Mar 20, 2025
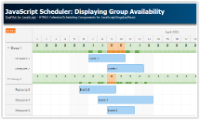
How to show availability of child resources using color bars in the JavaScript Scheduler component.
Jun 25, 2024
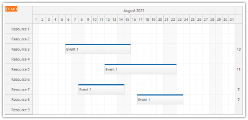
How to display a special column with summary data on the right side of the JavaScript Scheduler grid.
Aug 11, 2021
Articles 1-6 of 6