Features
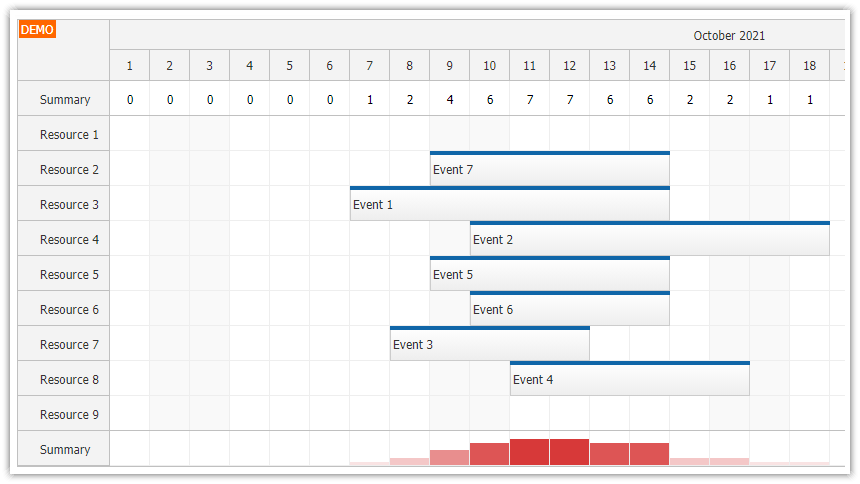
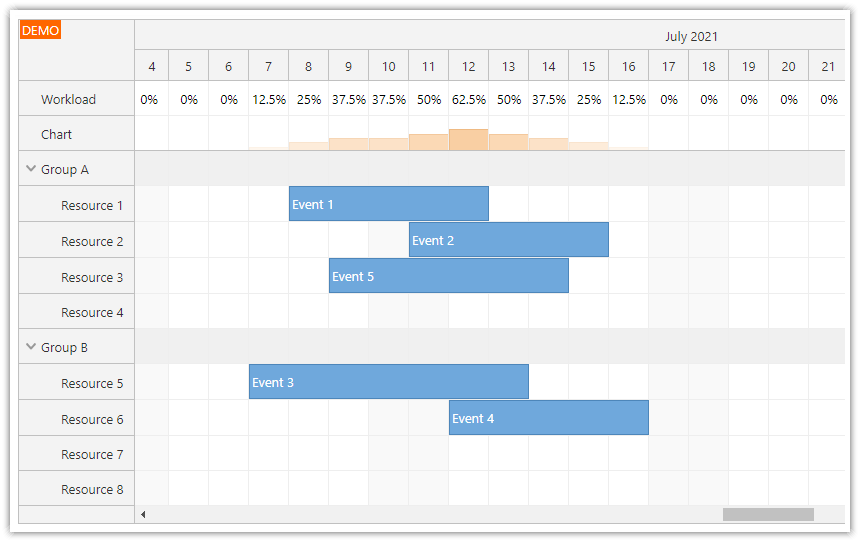
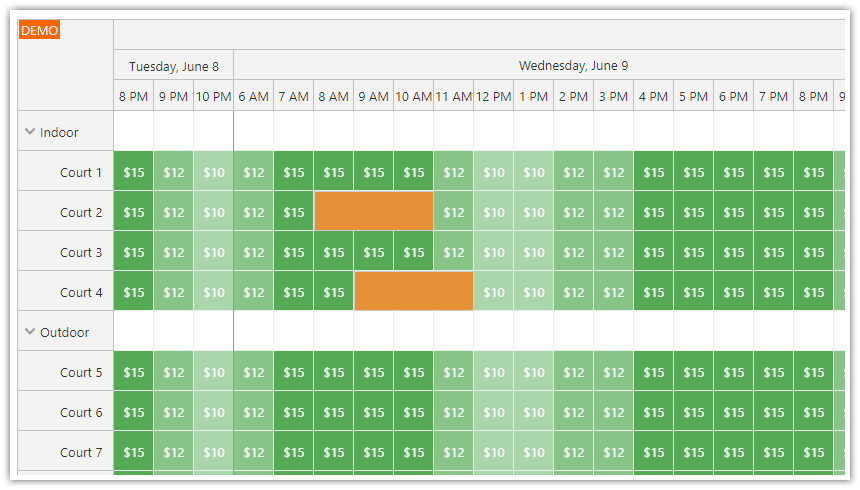
The parent rows of the JavaScript Scheduler component are used to display availability of child resources.
The parent row shows a number of available resources for each time slot.
The availability is also highlighted using color bars.
Includes a trial version of DayPilot Pro for JavaScript (see License below)
License
Licensed for testing and evaluation purposes. Please see the license agreement included in the sample project. You can use the source code of the tutorial if you are a licensed user of DayPilot Pro for JavaScript.
Live Demo
Calculating Availability of Child Resources in the JavaScript Scheduler

We will use onBeforeCellRender event to customize the content of the parent row cells. We will calculate the availability of the child resources and display the number of free slots:
onBeforeCellRender: (args) => {
  if (args.cell.isParent) {
    const children = dp.rows.find(args.cell.resource).children();
    const total = children.length;
    const used = children.filter(row => row.events.forRange(args.cell.start, args.cell.end).length > 0).length;
    const available = total - used;

    args.cell.html = `${available}`;
  }
}
This event handler finds all child resources for each parent node and looks for events. If there is an event found that overlaps a particular cell the resource is considered unavailable.
As the final step, we display the available resources in the cell using args.cell.html property.
Updating the Calculated Availability Automatically
The Scheduler only redraws the cells if it is necessary. By default, it also caches the onBeforeCellRender results to improve performance.
In order to force a refresh of the cells in the parent rows, we need to add cellsAutoUpdated: true to the parent nodes:
const resources = [
  {name: "Group 1", id: "G1", expanded: true, cellsAutoUpdated: true, children: [
      {name: "Resource 1", id: "R1"},
      {name: "Resource 2", id: "R2"}
  ]},
  {name: "Group 2", id: "G2", expanded: true, cellsAutoUpdated: true, children: [
      {name: "Resource 3", id: "R3"},
      {name: "Resource 4", id: "R4"},
      {name: "Resource 5", id: "R5"}
  ]},
];
This will ensure that the calculations in parent row cells are updated automatically after every drag and drop operation.
Styling the Parent Cells with Group Availability

Let's add some styling now - instead of displaying the number as a plain text we will display it using an active area. This will let us add some CSS styles an position the text in the middle of the cell.
onBeforeCellRender: (args) => {
  if (args.cell.isParent) {
    const children = dp.rows.find(args.cell.resource).children();
    const total = children.length;
    const used = children.filter(row => row.events.forRange(args.cell.start, args.cell.end).length > 0).length;
    const available = total - used;

    const w = dp.cellWidth / total;
    args.cell.areas = [];
    args.cell.areas.push({
      html: `${available}`,
      style: "text-align: center; font-size: 12px; font-weight: bold",
      top: 4,
      left: 0,
      right: 0
    });
  }
}
Highlighting the Group Availability using Color Bars

In order to make the summary easier to read we will use active areas to add color bars that highlight the child resource availability.
We will use light-green bar to indicate an free position, dark-green bar to indicate unavailable position, and orange bars to indicate that there is no available slot.
onBeforeCellRender: (args) => {
  if (args.cell.isParent) {
    const row = dp.rows.find(args.cell.resource);

    const children = row.children();
    const total = children.length;
    const used = children.filter(row => row.events.forRange(args.cell.start, args.cell.end).length > 0).length;
    const available = total - used;

    const w = dp.cellWidth / total;
    args.cell.areas = [];
    args.cell.areas.push({
      html: "" + available,
      style: "text-align: center; font-size: 12px; font-weight: bold",
      top: 4,
      left: 0,
      right: 0
    });

    args.cell.backColor = "#d9ead3";
    if (available === 0) {
      args.cell.backColor = "#f9cb9c";
    }

    DayPilot.list.for(total).forEach((item, i) => {
      let color = "#b6d7a8";
      if (i < used) {
        color = "#6aa84f";
      }
      if (available === 0) {
        color = "#e69138";
      }
      args.cell.areas.push({
        bottom: 0,
        height: 10,
        left: i * w,
        width: w - 1,
        backColor: color
      });
    });

  }
}
Full Source Code
Here is the complete source code for the JavaScript Scheduler component, which is configured to graphically display the total availability for a group of resources:
<!DOCTYPE html>
<html>
<head>
  <meta charset="utf-8"/>
  <title>JavaScript Scheduler: Displaying Group Availability</title>

  <!-- DayPilot library -->
  <script src="js/daypilot/daypilot-all.min.js"></script>

  <style>
    .scheduler_default_event_inner {
      background: #a8d3f4;
      border: 1px solid #83bcec;
      color: #000;
      border-radius: 5px;
    }
  </style>
</head>
<body>
<div class="header">
  <h1><a href='https://code.daypilot.org/97538/javascript-scheduler-displaying-group-availability'>JavaScript Scheduler: Displaying Group Availability</a></h1>
  <div><a href="https://javascript.daypilot.org/">DayPilot for JavaScript</a> - HTML5 Calendar/Scheduling Components for JavaScript/Angular/React</div>
</div>


<div class="main">
  <div id="dp"></div>
  <div class="generated">Generated using <a href="https://builder.daypilot.org/">DayPilot UI Builder</a>.</div>
</div>

<script>
  const dp = new DayPilot.Scheduler("dp", {
    timeHeaders: [
      {groupBy:"Month"},
      {groupBy:"Day", format:"d"}
    ],
    scale: "Day",
    days: 30,
    startDate: "2025-04-01",
    treeEnabled: true,
    treePreventParentUsage: true,
    rowMarginBottom: 5,
    rowMarginTop: 5,
    durationBarVisible: false,
    onTimeRangeSelected: async (args) => {
      const modal = await DayPilot.Modal.prompt("Create a new event:", "Event 1");
      dp.clearSelection();
      if (modal.canceled) {
        return;
      }
      dp.events.add({
        start: args.start,
        end: args.end,
        id: DayPilot.guid(),
        resource: args.resource,
        text: modal.result
      });
    },
    onBeforeCellRender: (args) => {
      if (args.cell.isParent) {
        const row = dp.rows.find(args.cell.resource);

        const children = row.children();
        const total = children.length;
        const used = children.filter(row => row.events.forRange(args.cell.start, args.cell.end).length > 0).length;
        const available = total - used;

        const w = dp.cellWidth / total;
        args.cell.areas = [];
        args.cell.areas.push({
          html: "" + available,
          style: "text-align: center; font-size: 12px; font-weight: bold",
          top: 4,
          left: 0,
          right: 0
        });

        args.cell.backColor = "#d9ead3";
        if (available === 0) {
          args.cell.backColor = "#f9cb9c";
        }

        DayPilot.list.for(total).forEach((item, i) => {
          let color = "#b6d7a8";
          if (i < used) {
            color = "#6aa84f";
          }
          if (available === 0) {
            color = "#e69138";
          }
          args.cell.areas.push({
            bottom: 0,
            height: 10,
            left: i * w,
            width: w - 1,
            backColor: color
          });
        });

      }
    }
  });
  dp.init();

  const app = {
    loadData() {
      const resources = [
        {
          name: "Group 1", id: "G1", expanded: true, cellsAutoUpdated: true, children: [
            { name: "Resource 1", id: "R1" },
            { name: "Resource 2", id: "R2" }
          ]
        },
        {
          name: "Group 2", id: "G2", expanded: true, cellsAutoUpdated: true, children: [
            { name: "Resource 3", id: "R3" },
            { name: "Resource 4", id: "R4" },
            { name: "Resource 5", id: "R5" }
          ]
        },
      ];
      const events = [{
        "start": "2025-04-07T00:00:00",
        "end": "2025-04-11T00:00:00",
        "id": "d4e5b76c-45b1-4c9f-bc3a-7d9e8b3f56cd",
        "resource": "R1",
        "text": "Event 1"
      }, {
        "start": "2025-04-09T00:00:00",
        "end": "2025-04-13T00:00:00",
        "id": "a2b3c7d8-e9f1-4b2a-9c0d-8e1f5a4b3c7d",
        "resource": "R2",
        "text": "Event 2"
      }, {
        "start": "2025-04-06T00:00:00",
        "end": "2025-04-10T00:00:00",
        "id": "b3c7d8e9-f1a2-4b2c-0d8e-1f5a4b3c7d8e",
        "resource": "R3",
        "text": "Event 3"
      }, {
        "start": "2025-04-08T00:00:00",
        "end": "2025-04-14T00:00:00",
        "id": "c7d8e9f1-a2b3-4c9f-0d8e-1f5a4b3c7d8e",
        "resource": "R4",
        "text": "Event 4"
      }, {
        "start": "2025-04-09T00:00:00",
        "end": "2025-04-12T00:00:00",
        "id": "d8e9f1a2-b3c7-4b2c-0d8e-1f5a4b3c7d8e",
        "resource": "R5",
        "text": "Event 5"
      }];

      dp.update({ resources, events });
    },
    init() {
      this.loadData();
    },
  };
  app.init();

</script>

</body>
</html> DayPilot
