Overview
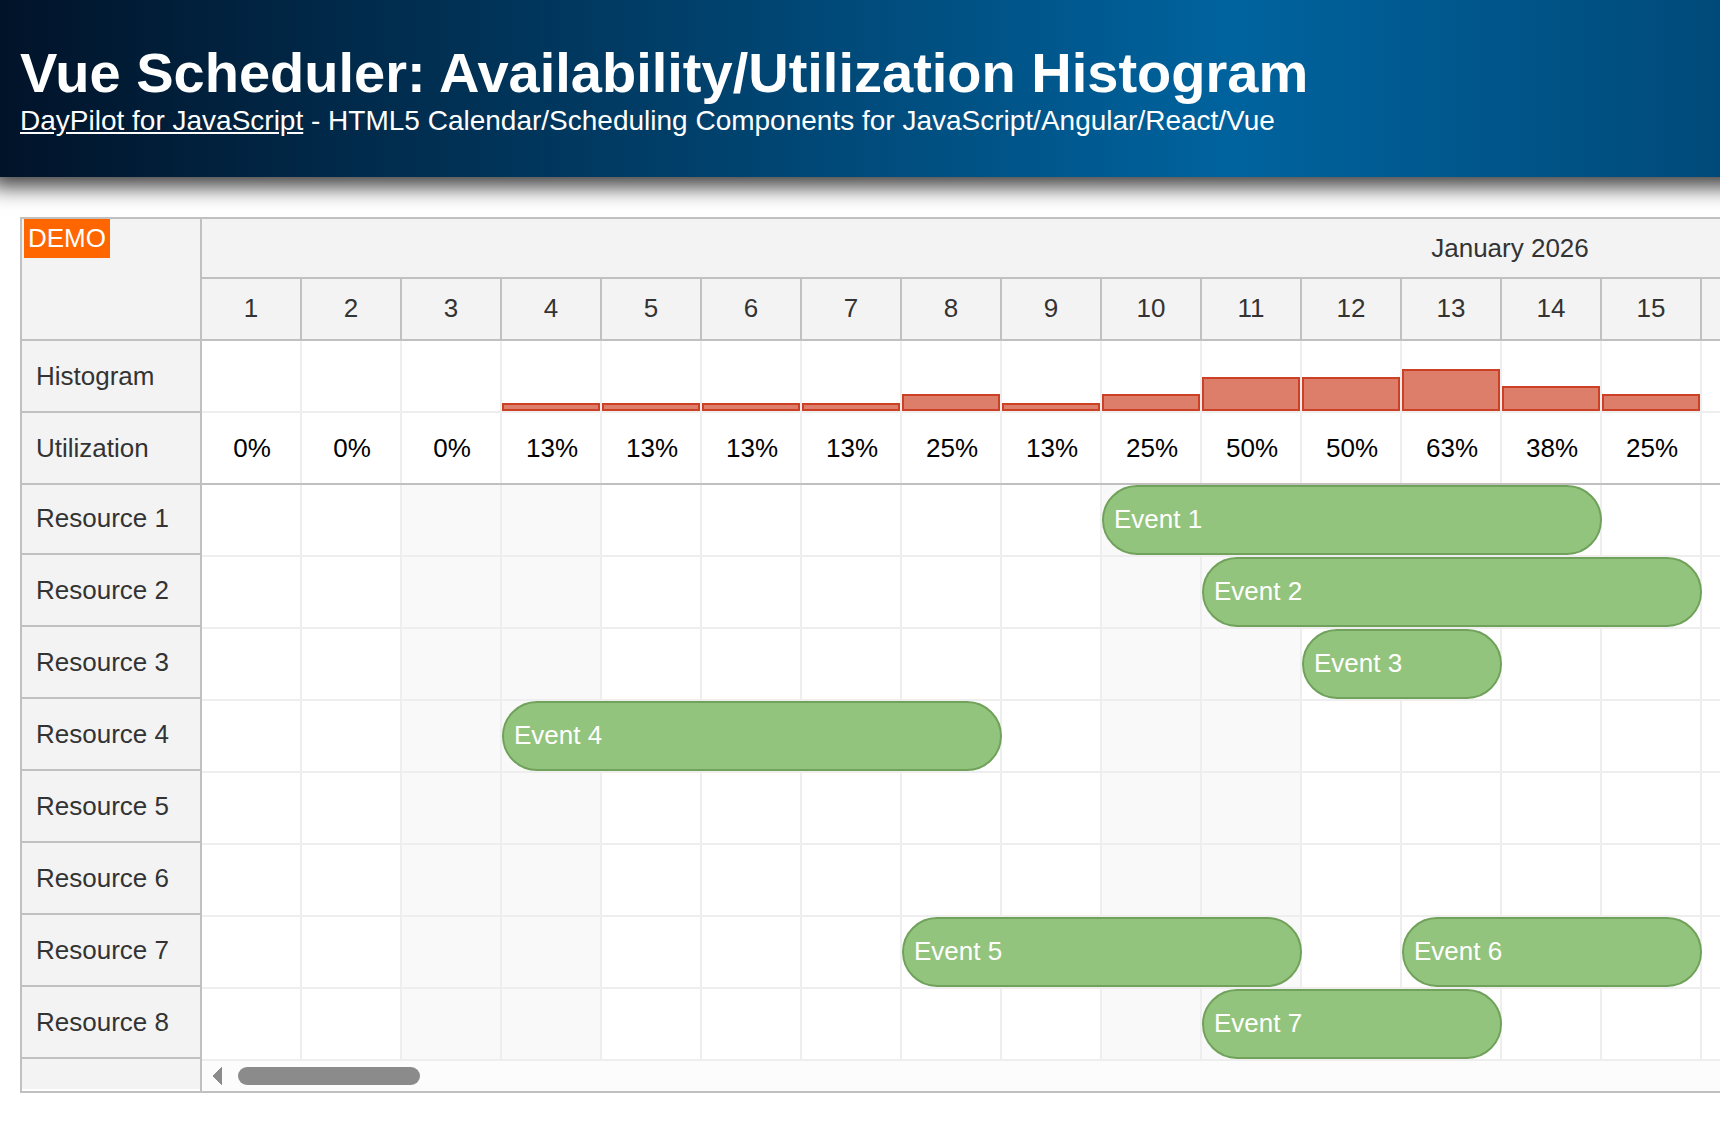
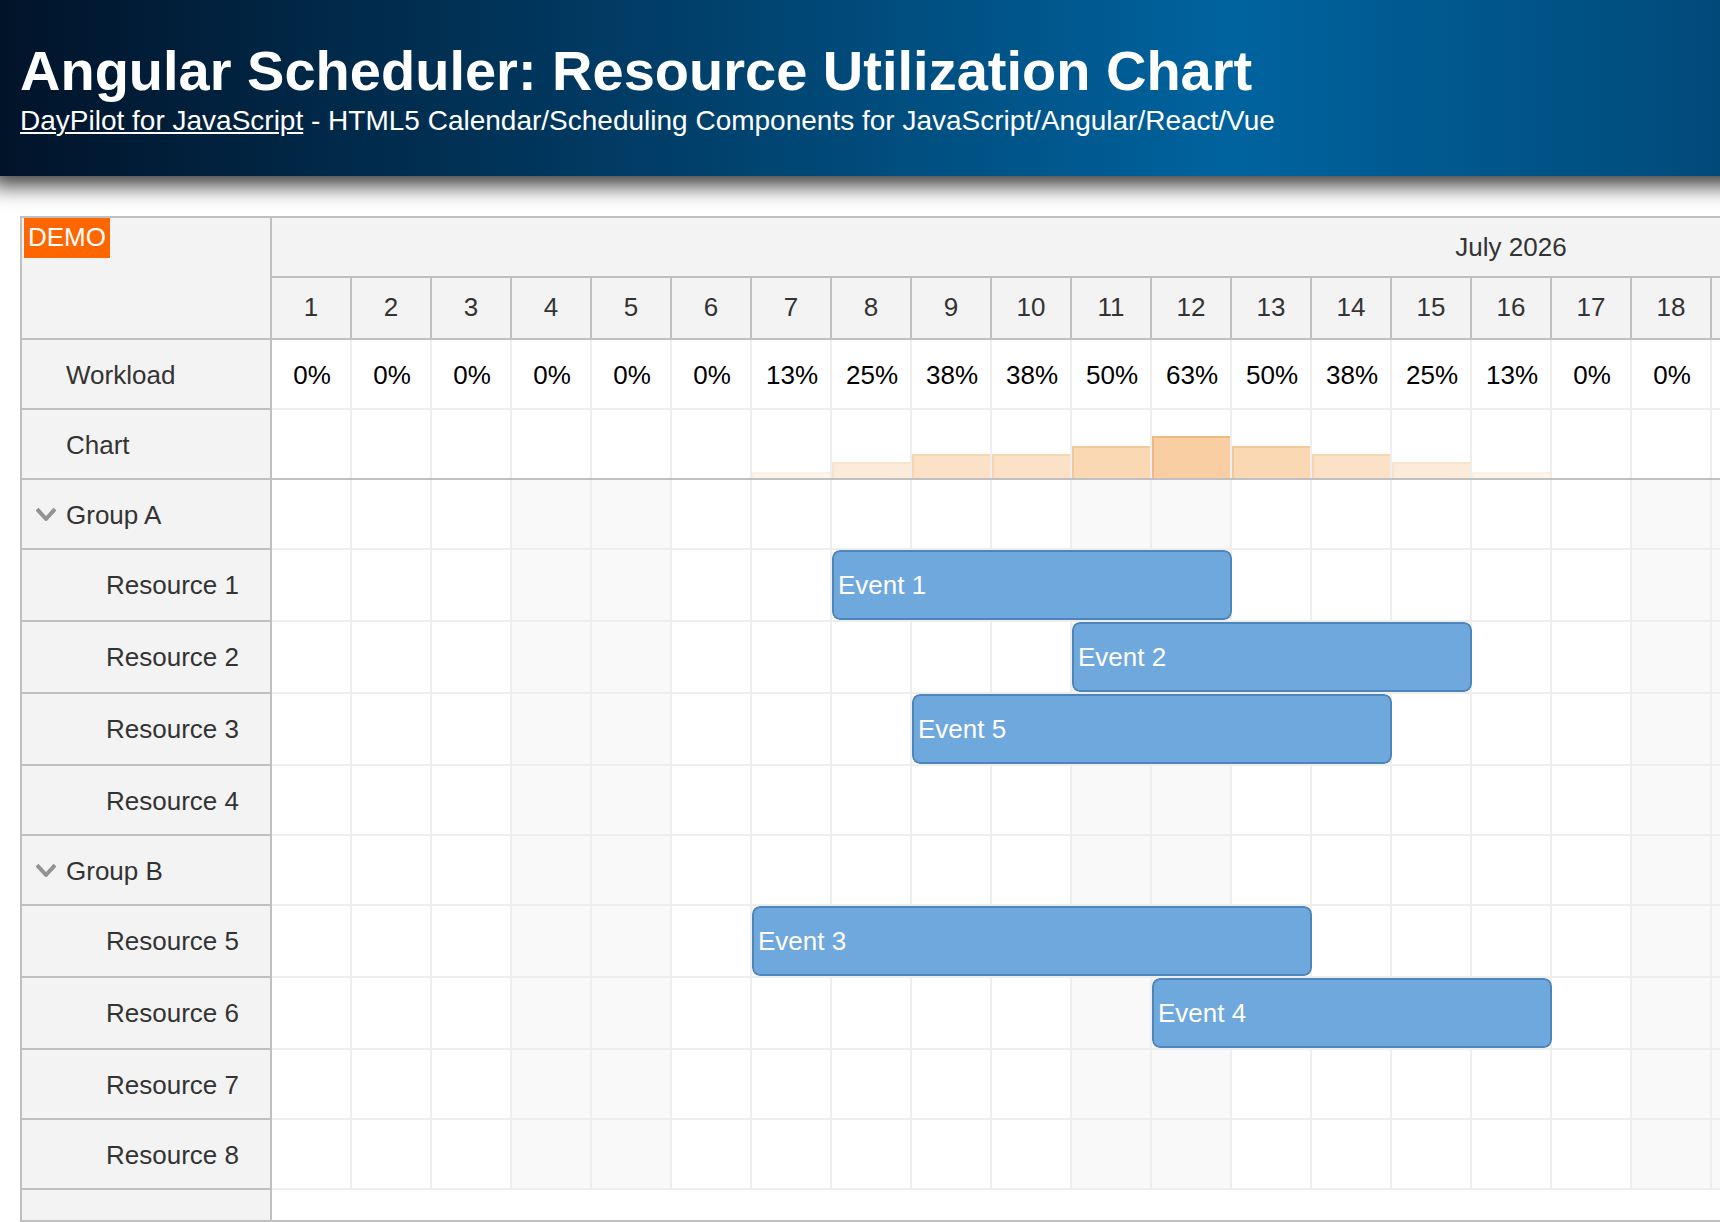
Calculate the percentage utilization of each resource displayed by the JavaScript Scheduler component.
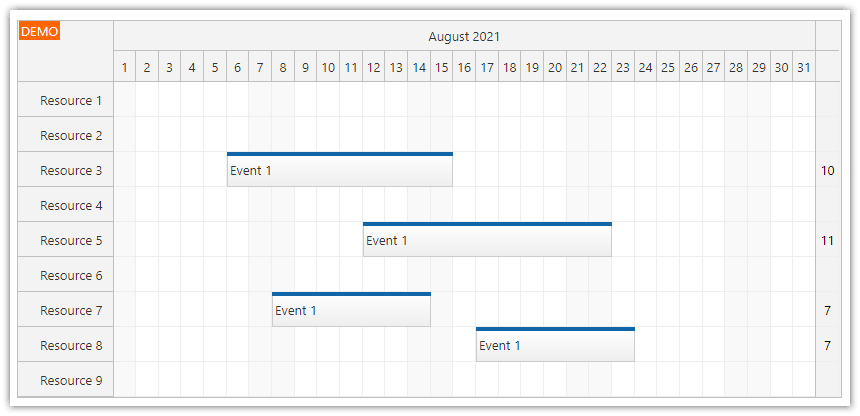
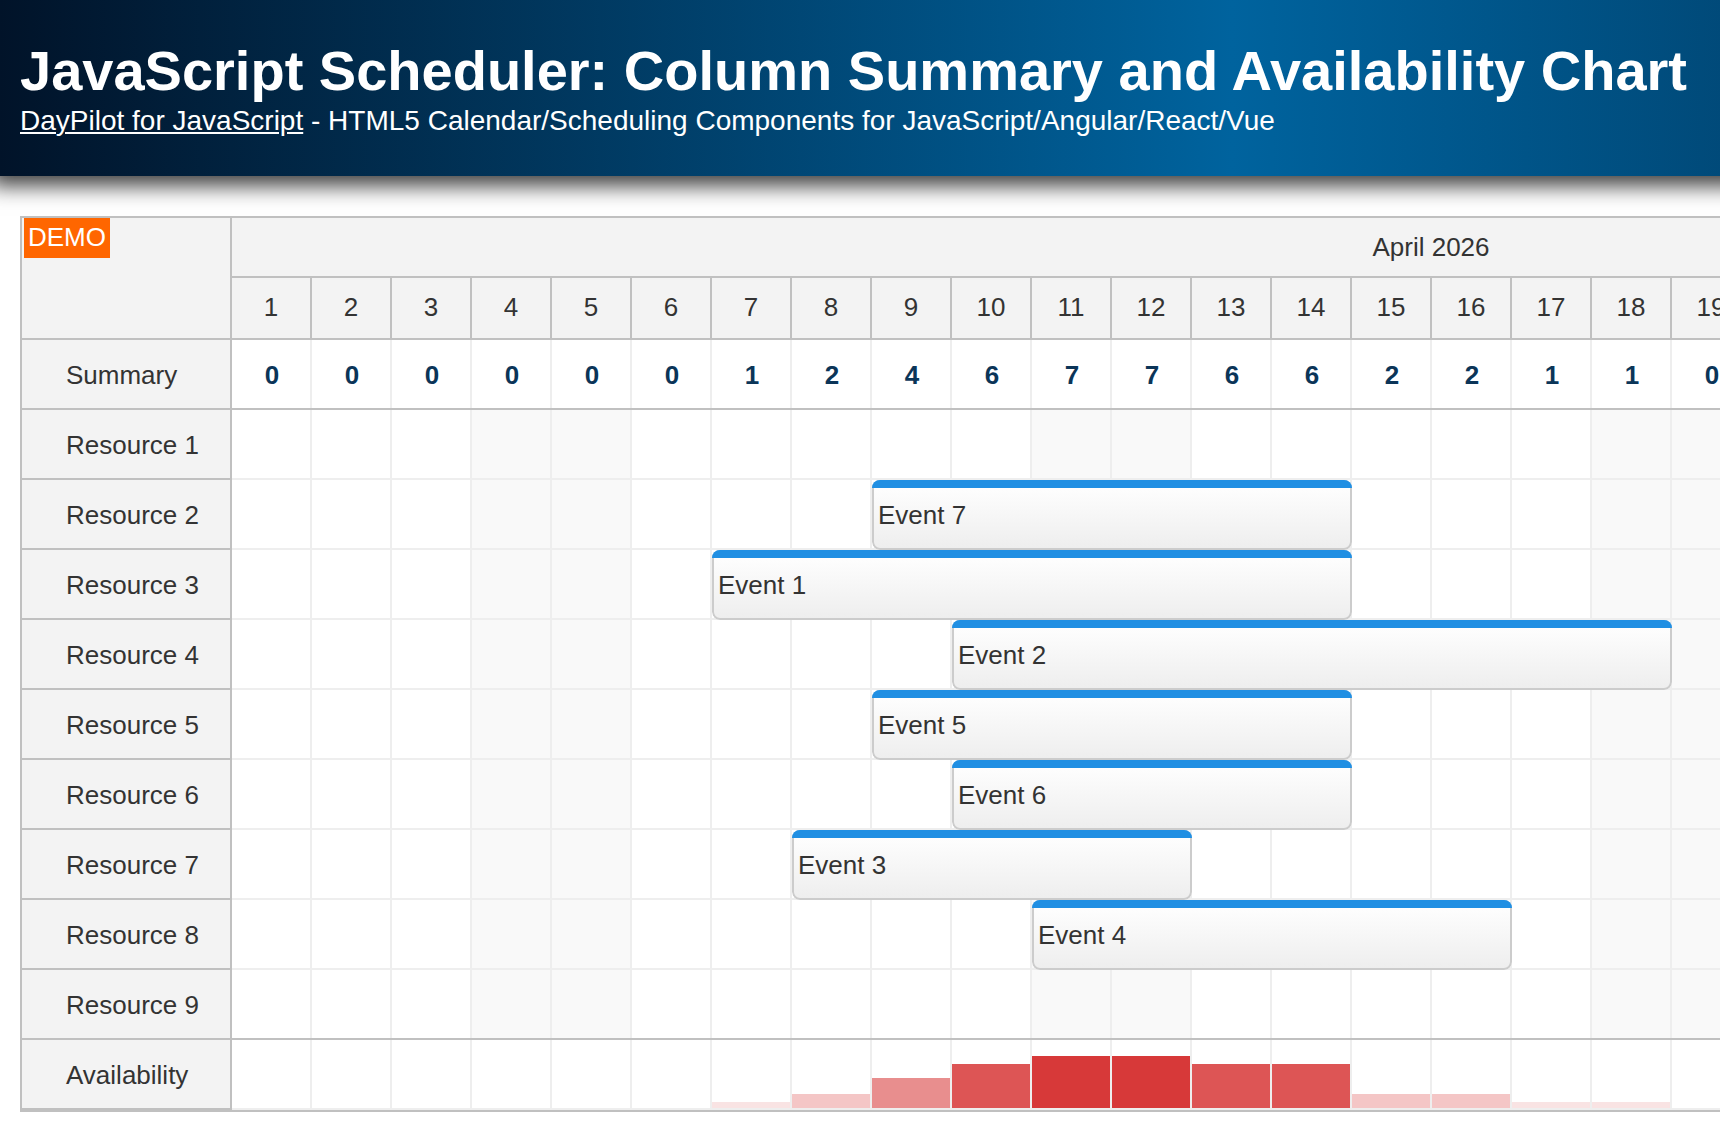
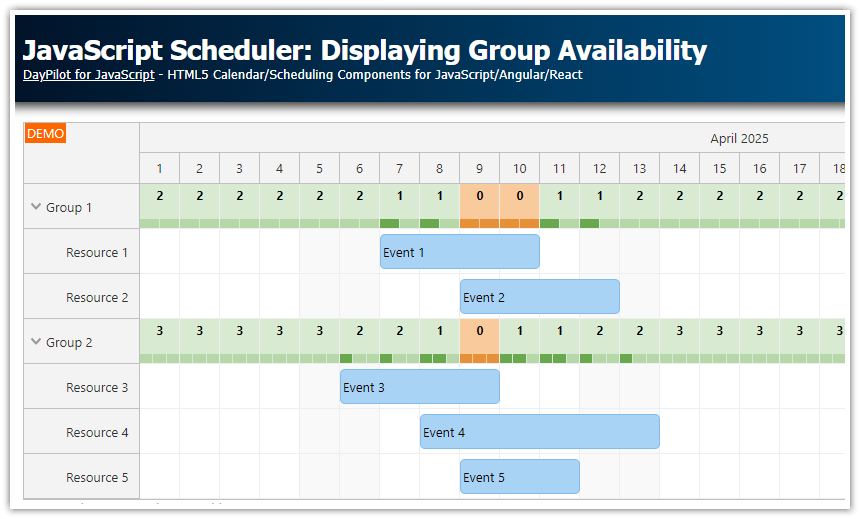
Display utilization and availability details in the Scheduler row header.
Show a utilization bar chart for a quick overview.
The downloadable project includes a trial version of DayPilot Pro for JavaScript (see License below).
License
Licensed for testing and evaluation purposes. Please see the license agreement included in the sample project. You can use the source code of the tutorial if you are a licensed user of DayPilot Pro for JavaScript. Buy a license.
Calculating Resource Utilization for Visible Time Range

Our goal is to show the percentage of slots utilized by the scheduled events. First, we define the row header columns in the Scheduler config:
{
  rowHeaderColumns: [
    {name: "Name", display: "name"},
    {name: "Utilization"}
  ],
  // ...
}
Now we will use the onBeforeRowHeaderRender event handler which lets us define custom row header content. This event is fired for every row before the header is rendered. The row headers are also updated when the row content (scheduled events) changes - this ensures it will always display the correct data.
onBeforeRowHeaderRender: args => {
  // ....
}
In the onBeforeRowHeaderRender, we need to calculate the total time occupied by scheduled events.
The
args.row.events.all()method returns all events that belong to the current row.We will create a sum of all event durations (it will be a DayPilot.Duration object).
onBeforeRowHeaderRender: args => {

  const utilization = args.row.events.all()
    .reduce((acc, e) => {
      return acc.add(e.duration());
    }, DayPilot.Duration.ofSeconds(0));

}
We have forbidden event overlaps of Scheduler events (allowEventOverlap: false) so we don’t have to account for overlaps during the calculations.
However, the list may also include events that only partially overlap with the row—either because they start before the row begins or end after the row ends. To fix this inaccuracy, we need to shorten these events if they overlap the row edges.
onBeforeRowHeaderRender: args => {

  const utilization = args.row.events.all()
    .map(item => {
      const eventStart = item.start() < rowStart ? rowStart : item.start();
      const eventEnd = item.end() > rowEnd ? rowEnd : item.end();
      return new DayPilot.Duration(eventStart, eventEnd);
    })
    .reduce((acc, duration) => {
      return acc.add(duration);
    }, DayPilot.Duration.ofSeconds(0));

}
Then we can calculate the available time:
const total = DayPilot.Duration.ofDays(scheduler.days);Now that we have the total event duration and the total slot size, we can calculate the percentage:
const percentage = Math.round(utilization.ticks / total.ticks * 100);We will display the calculated value in the “Utilization” column:
onBeforeRowHeaderRender: (args) => {
  const rowStart = scheduler.visibleStart();
  const rowEnd = scheduler.visibleEnd();

  const utilization = args.row.events.all()
    .map(item => {
      const eventStart = item.start() < rowStart ? rowStart : item.start();
      const eventEnd = item.end() > rowEnd ? rowEnd : item.end();
      return new DayPilot.Duration(eventStart, eventEnd);
    })
    .reduce((acc, duration) => {
      return acc.add(duration);
    }, DayPilot.Duration.ofSeconds(0));

  const total = DayPilot.Duration.ofDays(scheduler.days);
  const percentage = Math.round(utilization.ticks / total.ticks * 100);

  args.row.columns[1].text = percentage + "%";
}
Showing Utilization Chart in Scheduler Row Headers

We have calculated the utilization percentage and rendered in in the row headers as text.
In this step, we will add a bar to each row header that will display the utilization graphically.
The utilization bars will use different colors, depending on the percentage:
The basic color is green.
If the utilization is over 60%, the bar color will be orange.
For utilization higher than 80%, we will use red color.
const percentage = Math.round(utilization.ticks / total.ticks * 100);

const getColor = (percentage) => {
  if (percentage < 60) return "#66bb6a"; // Green
  if (percentage < 80) return "#ffba3b"; // Orange
  return "#e58473"; // Red
};
To show the chart, we will use active areas - they let us create elements with custom position and styling:
The first active area creates the bar background (full width).
The second active area fills an area that corresponds to the calculated percentage.
The third active areas will display the percentage text above the bar.
onBeforeRowHeaderRender: (args) => {

  // ...

  const percentage = Math.round(utilization.ticks / total.ticks * 100);

  const getColor = (percentage) => {
    if (percentage < 60) return "#66bb6a"; // Green
    if (percentage < 80) return "#ffba3b"; // Orange
    return "#e58473"; // Red
  };

  const color = getColor(percentage);

  args.row.columns[1].areas = [
    {height: 15, left: 2, bottom: 4, right: 2, backColor: "#ffffff", borderColor: "#cccccc", borderRadius: 4, style: "box-sizing: border-box"},
    {height: 15, left: 2, bottom: 4, width: `calc(${percentage}% - 4px)`, backColor: color, borderRadius: "4px"},
    {left: 0, bottom: 19, top: 0, right: 0, text: percentage + "%", fontColor: "#666666", horizontalAlignment: "center", verticalAlignment: "bottom"}
  ];
}
Full Source Code
Here is the full source code of our example that calculates utilization for each of the resource displayed by the JavaScript Scheduler and display percentages and graphical representation (bar chart) in the row headers.
<!DOCTYPE html>
<html>
<head>
  <meta charset="utf-8"/>
  <meta name="viewport" content="width=device-width, initial-scale=1">
  <title>JavaScript Scheduler: Resource Utilization Chart for Rows</title>

  <!-- DayPilot library -->
  <script src="js/daypilot/daypilot-all.min.js"></script>
</head>
<body>
<div class="header">
  <h1><a href='https://code.daypilot.org/58541/javascript-scheduler-resource-utilization-chart-for-rows'>JavaScript Scheduler: Resource Utilization Chart for Rows</a></h1>
  <div><a href="https://javascript.daypilot.org/">DayPilot for JavaScript</a> - HTML5 Calendar/Scheduling Components for JavaScript/Angular/React/Vue</div>
</div>

<div class="main">
  <div id="scheduler"></div>
  <div class="generated">Generated using <a href="https://builder.daypilot.org/">DayPilot UI Builder</a>.</div>
</div>

<script>
  const scheduler = new DayPilot.Scheduler("scheduler", {
    timeHeaders: [{"groupBy":"Month"},{"groupBy":"Day","format":"d"}],
    scale: "Day",
    days: 31,
    startDate: "2026-01-01",
    rowHeaderColumns: [
      {name: "Name", display: "name"},
      {name: "Utilization"}
    ],
    cellWidth: 60,
    rowMarginTop: 2,
    rowMarginBottom: 2,
    durationBarVisible: false,
    eventBorderRadius: "5px",
    allowEventOverlap: false,
    timeRangeSelectedHandling: "Enabled",
    onTimeRangeSelected: async (args) => {
      const scheduler = args.control;
      const modal = await DayPilot.Modal.prompt("Create a new event:", "Event 1");
      scheduler.clearSelection();
      if (modal.canceled) { return; }
      scheduler.events.add({
        start: args.start,
        end: args.end,
        id: DayPilot.guid(),
        resource: args.resource,
        text: modal.result
      });
    },
    treeEnabled: true,
    onBeforeEventRender: args => {
        args.data.backColor = "#1E757766";
        args.data.borderColor = "darker";
        args.data.fontColor = "#000000";
        args.data.padding = 4;
    },
    onBeforeRowHeaderRender: (args) => {
      const rowStart = scheduler.visibleStart();
      const rowEnd = scheduler.visibleEnd();

      const utilization = args.row.events.all()
        .map(item => {
          const eventStart = item.start() < rowStart ? rowStart : item.start();
          const eventEnd = item.end() > rowEnd ? rowEnd : item.end();
          return new DayPilot.Duration(eventStart, eventEnd);
        })
        .reduce((acc, duration) => {
          return acc.add(duration);
        }, DayPilot.Duration.ofSeconds(0));

      const total = DayPilot.Duration.ofDays(scheduler.days);
      const percentage = Math.round(utilization.ticks / total.ticks * 100);

      const getColor = (percentage) => {
        if (percentage < 60) return "#66bb6a"; // Green
        if (percentage < 80) return "#ffba3b"; // Orange
        return "#e58473"; // Red
      };

      const color = getColor(percentage);

      args.row.columns[1].areas = [
        {height: 15, left: 2, bottom: 4, right: 2, backColor: "#ffffff", borderColor: "#cccccc", borderRadius: 4, style: "box-sizing: border-box"},
        {height: 15, left: 2, bottom: 4, width: `calc(${percentage}% - 4px)`, backColor: color, borderRadius: "4px"},
        {left: 0, bottom: 19, top: 0, right: 0, text: percentage + "%", fontColor: "#666666", horizontalAlignment: "center", verticalAlignment: "bottom"}
      ];
    }
  });
  scheduler.init();

  const app = {
    init() {
      const resources = [
        {name: "Resource 1", id: "R1"},
        {name: "Resource 2", id: "R2"},
        {name: "Resource 3", id: "R3"},
        {name: "Resource 4", id: "R4"},
        {name: "Resource 5", id: "R5"},
        {name: "Resource 6", id: "R6"},
        {name: "Resource 7", id: "R7"},
        {name: "Resource 8", id: "R8"},
        {name: "Resource 9", id: "R9"},
      ];
      const events = [
        {start: "2026-01-05T00:00:00", end: "2026-01-10T00:00:00", id: 1, resource: "R2", text: "Event 1"},
        {start: "2026-01-02T00:00:00", end: "2026-01-18T00:00:00", id: 2, resource: "R4", text: "Event 2"},
        {start: "2026-01-19T00:00:00", end: "2026-01-28T00:00:00", id: 3, resource: "R4", text: "Event 3"},
        {start: "2026-01-15T00:00:00", end: "2026-01-21T00:00:00", id: 4, resource: "R2", text: "Event 4"},
        {start: "2026-01-10T00:00:00", end: "2026-01-30T00:00:00", id: 5, resource: "R6", text: "Event 5"},

      ];
      scheduler.update({resources, events});
    }
  };
  app.init();
</script>

</body>
</html>
You can download the full project using the link at the top of the tutorial.