Overview
The JavaScript Scheduler component can display frozen columns with additional data (including row summary) on the left side, in the row headers.
Using the workaround described in this tutorial, you can display the summary on the right side as well.
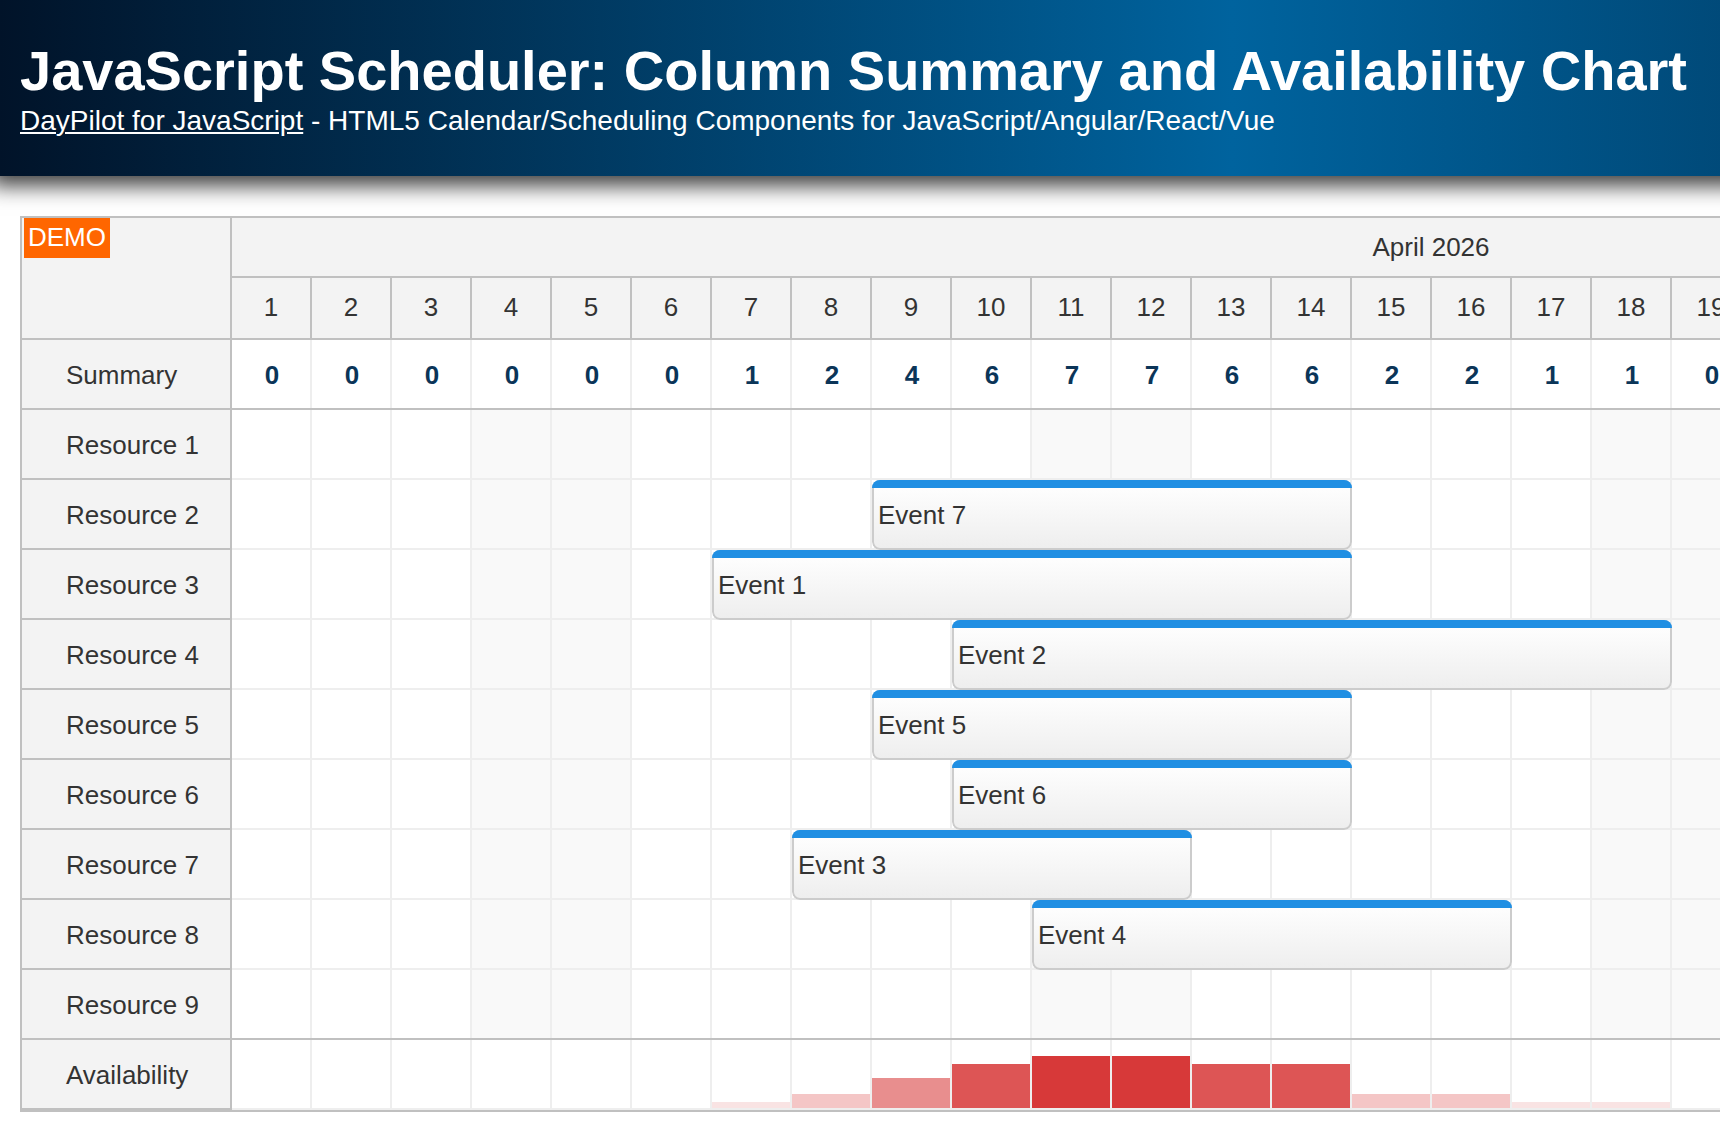
To learn how to display column summaries at the top or bottom of the Scheduler, please see the following tutorial: JavaScript Scheduler: Column Summary and Availability Chart.
License
Licensed for testing and evaluation purposes. Please see the license agreement included in the sample project. You can use the source code of the tutorial if you are a licensed user of DayPilot Pro for JavaScript.
How to display summary columns in the JavaScript Scheduler

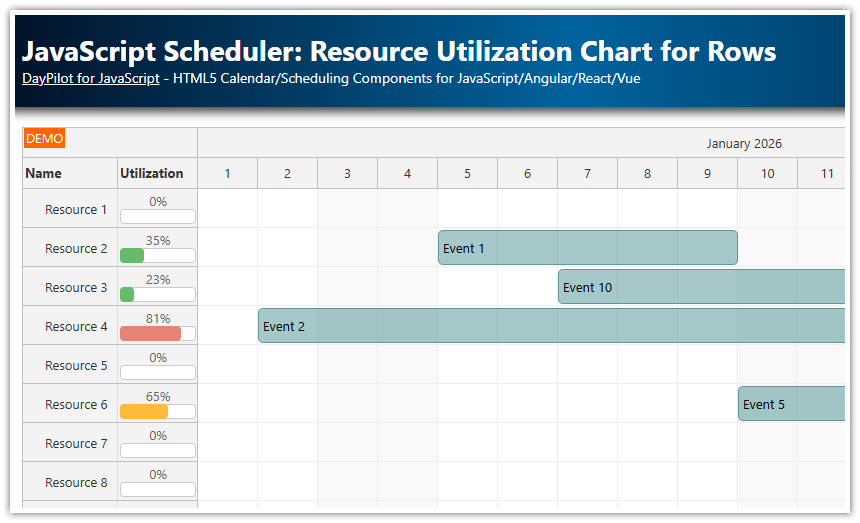
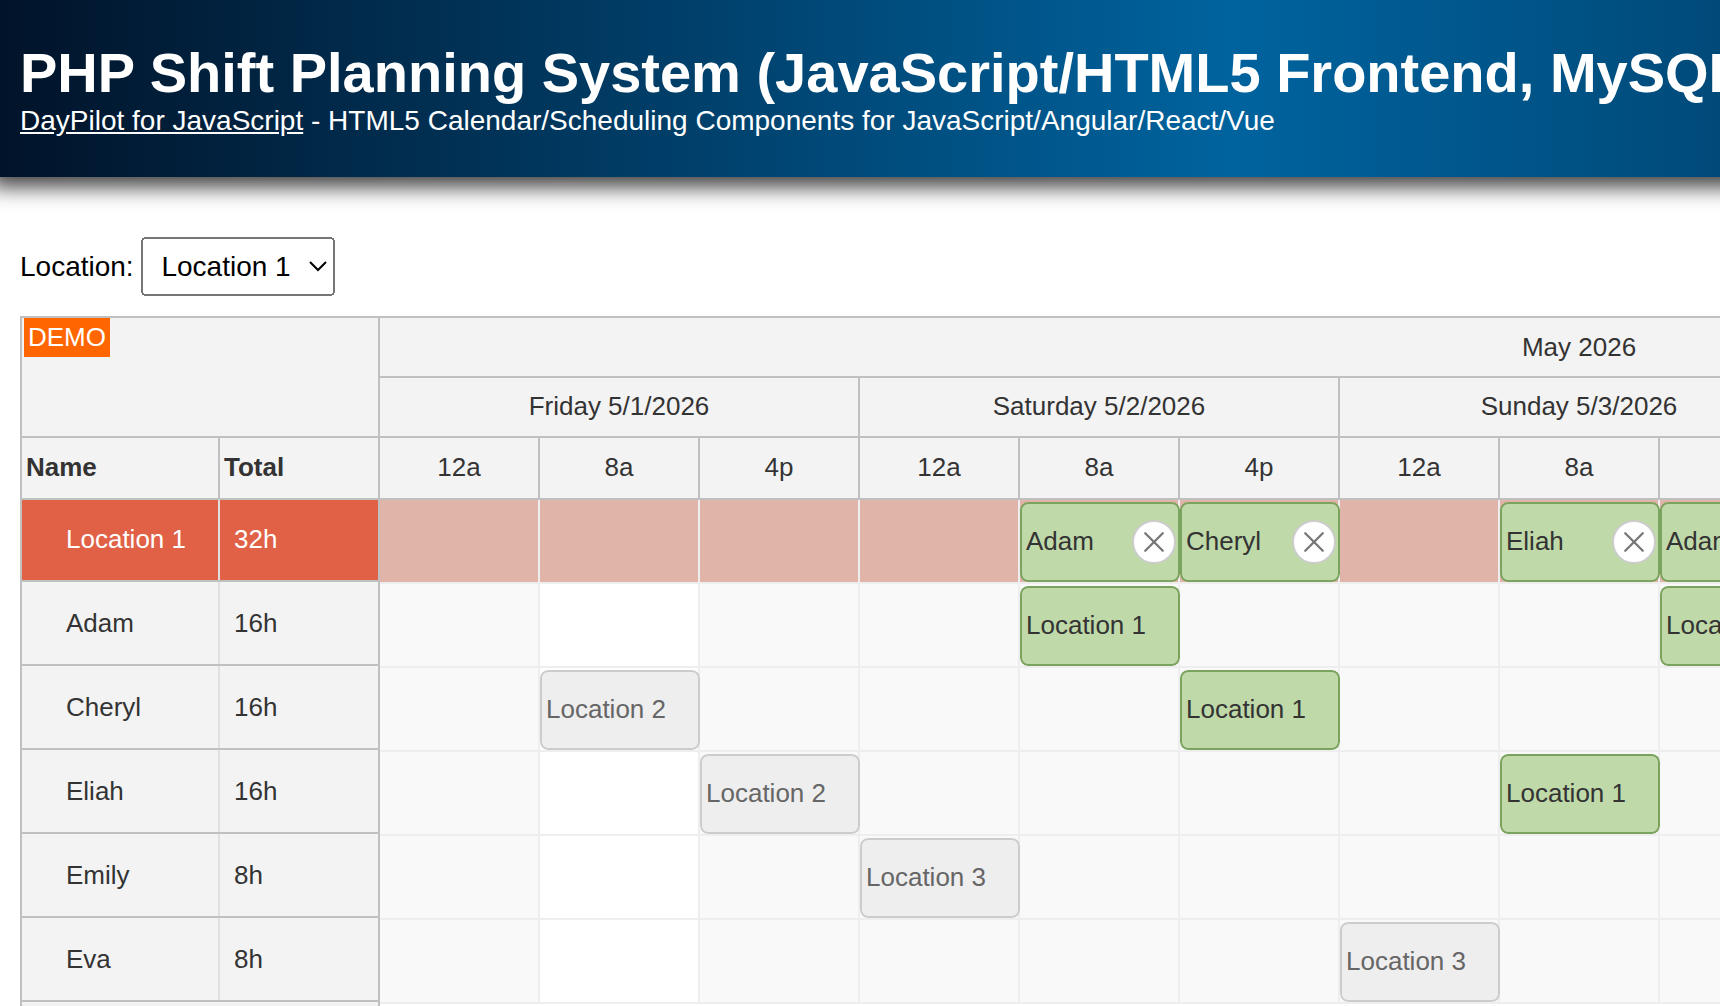
The Scheduler can display summary columns in the row headers that are displayed on the left. This is also the best way to display the summary columns:
The row headers are frozen and don’t move with the Scheduler grid.
If there are many columns, you can enable a horizontal scrollbar for the row headers.
You can show/hide individual columns programmatically or using a context menu.
The row header columns can be resized using drag and drop.
You can show/hide the header using an icon.
The width of the columns can be set automatically according to the content.
You can sort the rows by the specified columns.
How to display the summary on the right

If you want to display the columns on the right, you can use the workaround described in this tutorial.
This solution has a few limitations:
The summary column is displayed as the last column of the grid. This means this column is not frozen and it will scroll with the grid.
This example uses the automatic cell width feature to avoid the horizontal scrollbar. But in this case, the summary column width must have the standard width (the same as the other grid columns).
How to add columns to the end of the timeline

To display the columns at the end, you need to generate a custom timeline and add the summary columns as special time slots at the end:
The createTimeline() function generates the timeline of our custom view.
First, it adds the date columns (in this case it shows the days of the current month).
After the last day of the month, we add a special time slot with a date in far future (“2100-01-01”). This column will display the summary.
const summaryStart = new DayPilot.Date("2100-01-01");

const dp = new DayPilot.Scheduler("dp", {
  timeHeaders: [{"groupBy":"Month"},{"groupBy":"Day","format":"d"}],
  scale: "Manual",
  timeline: createTimeline(),
  // ...
});


function createTimeline() {
  const timeline = [];
  const first = DayPilot.Date.today().firstDayOfMonth();
  const days = DayPilot.Date.today().daysInMonth();
  for (let i = 0; i < days; i++) {
    const start = first.addDays(i);
    timeline.push({
      start: start,
      end: start.addDays(1)
    });
  }

  timeline.push({
    start: summaryStart,
    end: summaryStart.addDays(1)
  });
  return timeline;
}
How to calculate and display the summary data

To add data to the summary column, we need to set custom cell content using onBeforeCellRender event:
onBeforeCellRender: args => {
  if (args.cell.start === summaryStart) {
    args.cell.properties.disabled = true;
    args.cell.properties.backColor = "#f3f3f3";

    const row = dp.rows.find(args.cell.resource);
    const total = row.events.totalDuration();

    if (total.totalDays() > 0) {
      // args.cell.properties.html = total.totalDays();
      args.cell.properties.areas = [
        {
          left: 0,
          right: 0,
          top: 0,
          bottom: 0,
          style: "display: flex; justify-content: center; align-items: center;",
          html: total.totalDays()
        }
      ];
    }
    else {
      args.cell.properties.areas = [];
    }

  }
},
The easiest way to display the data is to use the args.cell.properties.html property:
args.cell.properties.html = total.totalDays();But we want to center the content horizontally and vertically so we use an active area with custom styles instead:
args.cell.properties.areas = [
  {
    left: 0,
    right: 0,
    top: 0,
    bottom: 0,
    style: "display: flex; justify-content: center; align-items: center;",
    html: total.totalDays()
  }
];
Don’t forget to disable the cell content caching. This will force the JavaScript Scheduler to recalculate the cell content on every change:
beforeCellRenderCaching: false,