")
Overview
How to configure the JavaScript Scheduler component to display a monthly timesheet.
ASP.NET Core backend that handles data access using SQL Server (LocalDB) and Entity Framework.
Allow creation of timesheet records using drag and drop.
How to calculate and display utilization using a histogram (for days and time slots).
Includes a trial version of DayPilot Pro for JavaScript (see License below)
License
Licensed for testing and evaluation purposes. Please see the license agreement included in the sample project. You can use the source code of the tutorial if you are a licensed user of DayPilot Pro for JavaScript. Buy a license.
Scheduler Timesheet Mode: Display Days as Rows
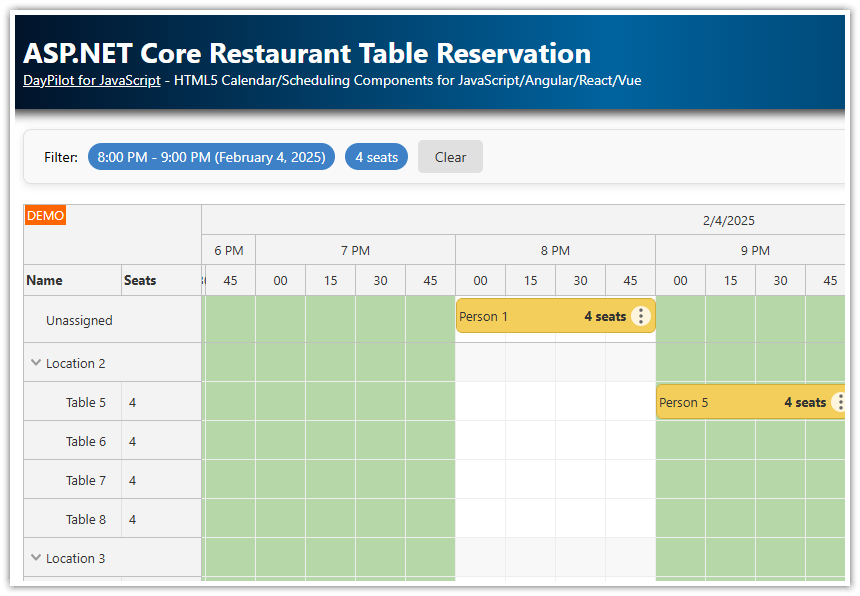
In the default mode, the JavaScript Scheduler component displays a timeline for multiple resources - it shows time on the horizontal axis and resources (locations, people, tools) on the vertical axis:

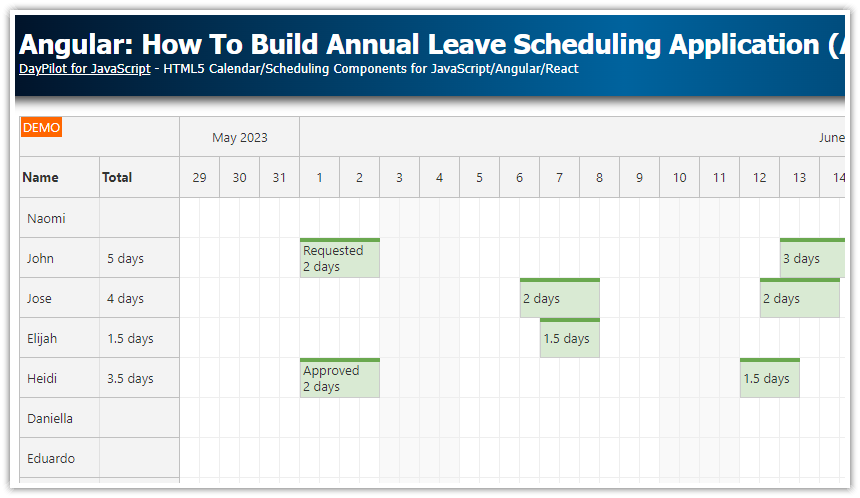
In order to implement a timesheet, you can switch the Scheduler to a special mode which displays days on the vertical axis. The horizontal axis will display hours of day:

To switch the JavaScript Scheduler to the timesheet view, add viewType: "Days" to the configuration.
This is a basic configuration that shows a timesheet with 15-minute cells:
<div id="dp"></div>

<script src="lib/daypilot/daypilot-all.min.js"></script>
<script>
    const timesheet = new DayPilot.Scheduler("dp",
        {
            viewType: "Days",
            startDate: "2025-10-01",
            days: 30,
            scale: "CellDuration",
            cellDuration: 15,
            timeHeaders: [
                { groupBy: "Hour", format: "h tt" },
                { groupBy: "Cell", format: "mm" }
            ],
        });
    timesheet.init();

</script>
In addition to the viewType property, we have also added a timeHeaders array which specifies the time headers (the first row displays hours, the second row displays 15-minute blocks).
Each timesheet cell will have a duration of 15 minutes (scale: "CellDuration" and cellDuration: 15).
Timesheet business hours
By default, the timesheet displays a full 24-hour range on the horizontal axis. The timesheet view can also be limited to business hours using the showNonBusiness property:
showNonBusiness: falseThe business hours are defined using businessBeginsHour and businessEndsHour properties. The default business hours are from 9 am to 5 pm. You can also define custom values:
businessBeginsHour: 10,
businessEndsHour: 18,
Additional row header columns

We will display custom row header columns that will show additional data for each row:
day of the week
total duration of all events
First, we need to define the columns using rowHeaderColumns property:
rowHeaderColumns: [
    { name: "Date" },
    { name: "Day" },
    { name: "Total" },
],
Now we calculate the values using onBeforeRowHeaderRender event handler.
The first column automatically displays the default value (date).
The second column (
args.row.columns[1]) will display the day of week.The third column (
args.row.columns[2]) will display the total duration of all event which we can get using theargs.row.events.totalDuration()method.
const timesheet = new DayPilot.Scheduler("dp", {
    // ...
    rowHeaderColumns: [
        { name: "Date" },
        { name: "Day" },
        { name: "Total" },
    ],
    onBeforeRowHeaderRender: args => {
        args.row.columns[1].text = args.row.start.toString("dddd");

        const totalDuration = args.row.events.totalDuration();
        args.row.columns[2].text = Math.floor(totalDuration.totalHours()) + ":" + totalDuration.toString("mm");
    },
});
How to display a histogram in a row frozen at the top of the timesheet

In the timesheet mode, the rows are generated by the Scheduler. It displays one row for each day - the number of days is specified using the days config property.
Using the resources property, you can specify rows that will be displayed in addition to the generated days. We will use this option to add a special row frozen at the top of the ASP.NET Core Scheduler component.
resources: [
    {name: "Histogram", id: "histogram", frozen: "top", cellsAutoUpdated: true, cellsDisabled: true }
],
This row will display a histogram chart - each time slot will show a bar with height set according to the number of events in that slot.
We will add the histogram bars to the frozen row cells dynamically using onBeforeCellRender event handler:
const timesheet = new DayPilot.Scheduler("dp", {
    // ...
    resources: [
        {name: "Histogram", id: "histogram", frozen: "top", cellsAutoUpdated: true, cellsDisabled: true }
    ],
    onBeforeCellRender: args => {

        if (args.cell.resource === "histogram") {
            const max = timesheet.rows.all().filter(r => r.data.frozen !== "top" && r.children().length === 0).length;

            const cStartTime = args.cell.start.getTimePart();
            const cEndTime = args.cell.end.getTimePart();

            const allEventParts = timesheet.rows.all().flatMap(row => row.events.all());
            const inUse = allEventParts.filter(e => {
                const eStartTime = e.part.start.getTimePart();
                const eEndTime = e.part.end === e.part.start.addDays(1) ? DayPilot.Duration.ofDays(1).totalMilliseconds() :e.part.end.getTimePart();
                return DayPilot.Util.overlaps(cStartTime, cEndTime, eStartTime, eEndTime);
            }).length;

            const percentage = inUse / max;

            args.cell.properties.backColor = "#ffffff";
            if (inUse > 0) {

                const cellHeight = timesheet.eventHeight - 1;
                const barHeight = Math.min(percentage, 1) * cellHeight;

                args.cell.properties.areas = [
                    {
                        bottom: 1,
                        height: barHeight,
                        left: 3,
                        right: 3,
                        backColor: "#dd7e6b",
                        style: "box-sizing: border-box; border: 1px solid #cc4125;",
                    }
                ];
            }
        }

    }
});
Timesheet with a daily histogram

The daily histogram is calculated as a percentage of an 8-hour workday:
The
args.row.events.totalDuration()method returns the total duration of all events in a row (day).The
maxvariable specifies the total time available (8 hours).The event handler renders a background bar (light yellow) with a width of 40 pixels.
The actual time usage is rendered as a dark yellow bar.
onBeforeRowHeaderRender: args => {

    // ...

    const max = DayPilot.Duration.ofHours(8);
    const pct = args.row.events.totalDuration().totalSeconds() / max.totalSeconds();
    args.row.columns[2].areas = [
        {
            bottom: 0,
            left: 0,
            width: 40,
            height: 4,
            backColor: "#ffe599",
        },
        {
            bottom: 0,
            left: 0,
            width: 40 * pct,
            height: 4,
            backColor: "#f1c232",
        }
    ];
},
Load timesheet data in ASP.NET Core
On the client side, we load the timesheet data using events.load() which is a helper method for loading the Scheduler data directly from a remote URL:
const app = {
  init() {
      timesheet.events.load("/api/TimesheetEvents");
  }
};
The Scheduler automatically adds start and end query string parameters to the specified URL, with values calculated from the current view (the beginning of the first day and the end of the last day, respectively).
Example:
GET /api/TimesheetEvents?start=2025-10-01T00:00:00&end=2025-11-01T00:00:00On the server side, we use the standard ASP.NET Core API controller implementation generated by the Entity Framework from the model classes.
We just need to extend it to limit the data set to the provided date range:
The
GetEvents()method which handles theGET /api/TimesheetEventsrequests accepts start and endDateTimeparameters.The events are filtered using
Where()method.
[Route("api/[controller]")]
[ApiController]
public class TimesheetEventsController : ControllerBase
{
    private readonly TimesheetDbContext _context;

    public TimesheetEventsController(TimesheetDbContext context)
    {
        _context = context;
    }

    // GET: api/TimesheetEvents
    [HttpGet]
    public async Task<ActionResult<IEnumerable<TimesheetEvent>>> GetEvents([FromQuery] DateTime start, [FromQuery] DateTime end)
    {
        return await _context.Events
            .Where(e => !((e.End <= start) || (e.Start >= end)))
            .ToListAsync();
    }

}
Data Model and SQL Server Database Schema
The database schema is generated from code using Entity Framework migrations (we use the “code first” approach).
Our TimesheetEvent model class that represents the timesheet records looks like this:
namespace Project.Model
{
    public class TimesheetEvent
    {
        public int Id { get; set; }
        public DateTime Start { get; set; }
        public DateTime End { get; set; }
        public string? Text { get; set; }
        public string? Color { get; set; }
    }
}
SQL Server Database Initialization
Our ASP.NET Core Timesheet application is configured to automatically create and initialize the database (if necessary) on startup.
You can find the initialization code in Program.cs:
using (var serviceScope = app.Services.CreateScope())
{
    var services = serviceScope.ServiceProvider;
    try
    {
        var context = services.GetRequiredService<TimesheetDbContext>();
        context.Database.EnsureCreated();
    }
    catch (Exception ex)
    {
        var logger = services.GetRequiredService<ILogger<Program>>();
        logger.LogError(ex, "An error occurred creating the DB.");
    }
}
The database uses a LocalDB instance of SQL Server. If you want to change the database file name and/or location, edit the connection string ("TimesheetContext") in appsettings.json:
{
    "Logging": {
        "LogLevel": {
            "Default": "Information",
            "Microsoft.AspNetCore": "Warning"
        }
    },
    "ConnectionStrings": {
        "TimesheetContext": "Server=(localdb)\\mssqllocaldb;Database=DayPilot.TutorialAspNetCoreTimesheet;Trusted_Connection=True"
    },
    "AllowedHosts": "*"
}
History
April 30, 2025: Upgraded to .NET 9; row summary calculation fixed for records that have 24 hours; column summary fixed for records spanning multiple days; long events display total duration in hours; upgraded to DayPilot Pro 2025.2.6442
June 6, 2024: Upgraded to .NET 8
June 4, 2023: Upgraded to .NET 7
April 11, 2022: Initial release (.NET 6)