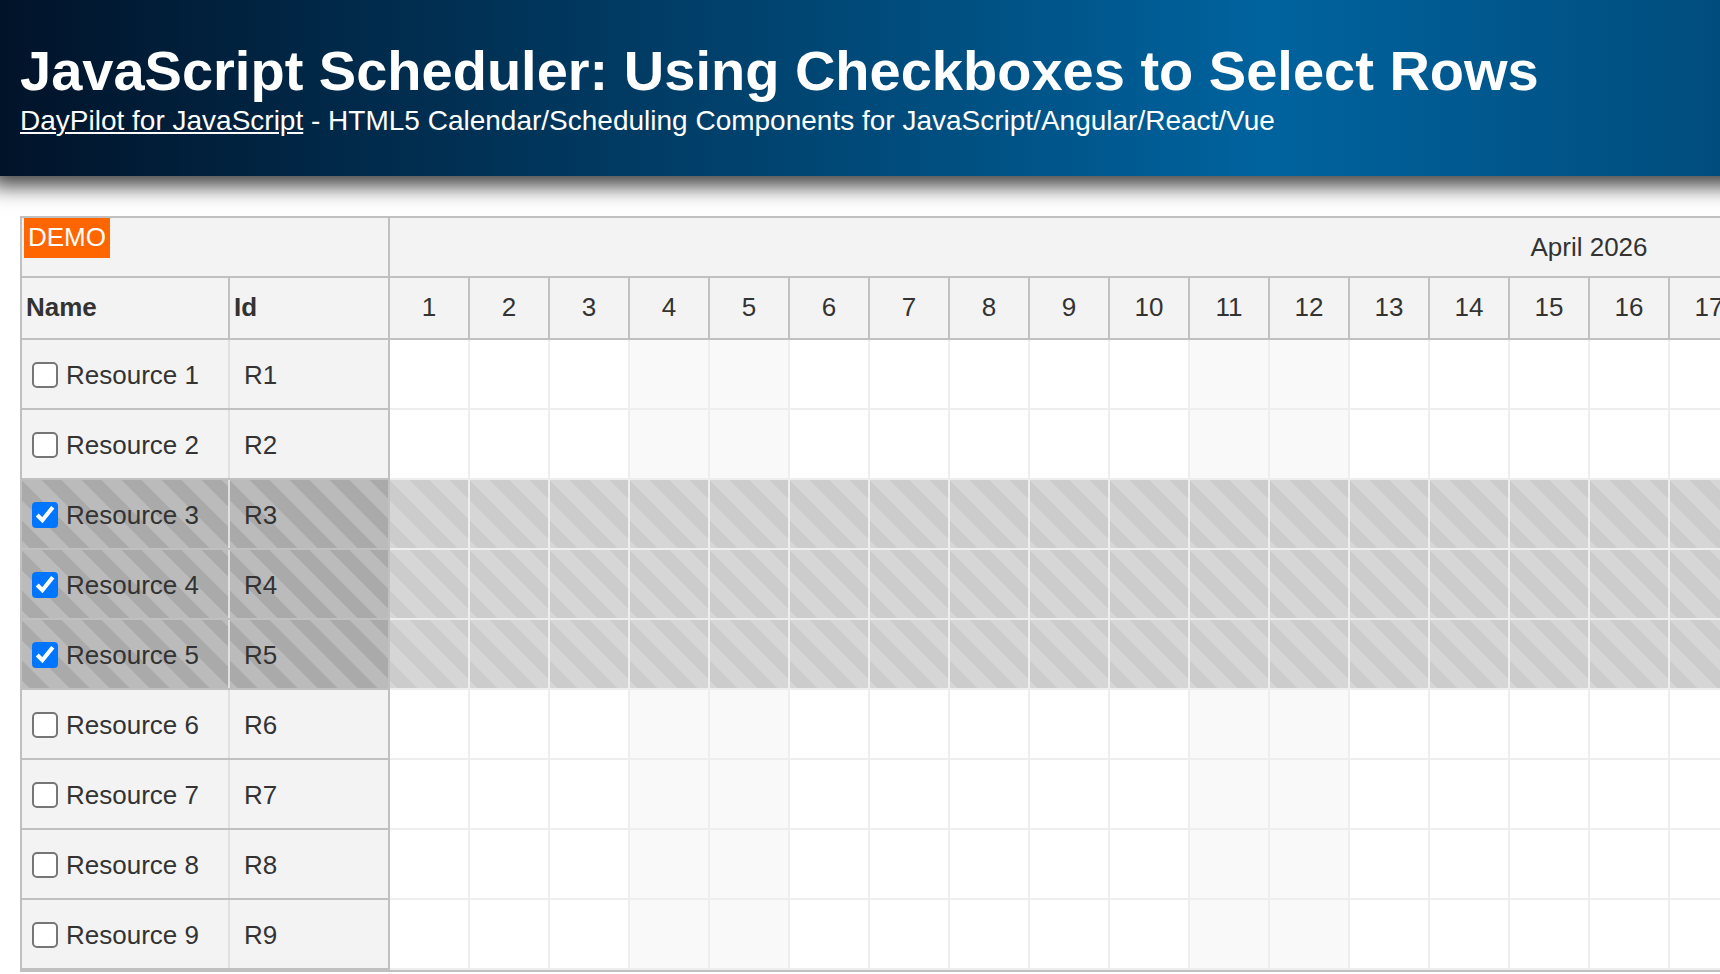
Overview
How to modify a Gantt chart project generated using DayPilot UI Builder to display configurable row header columns.
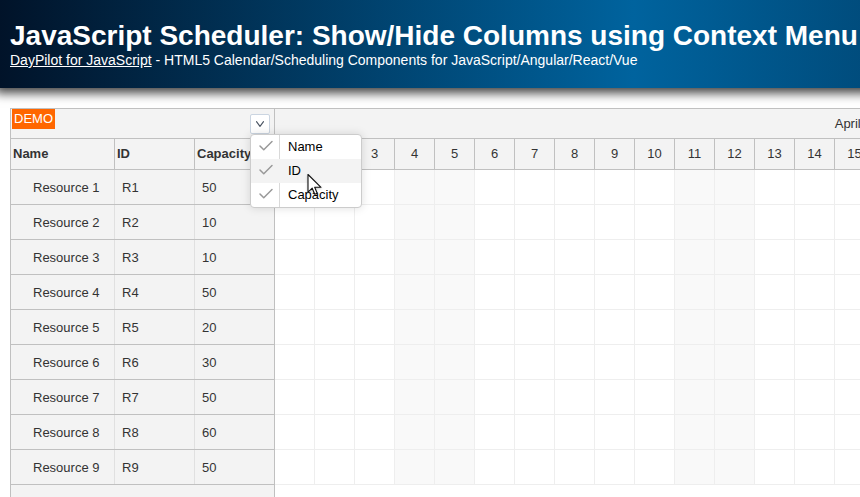
A context menu is added to the header to allow hiding selected columns.
The context menu items are generated dynamically from the list of current Gantt chart columns.
Requires DayPilot Pro for JavaScript 2020.2.4377 or later
Includes a trial version of DayPilot Pro for JavaScript (see License below)
License
Licensed for testing and evaluation purposes. Please see the license agreement included in the sample project. You can use the source code of the tutorial if you are a licensed user of DayPilot Pro for JavaScript.
Live Demo
Gantt Chart Data Columns

This Gantt chart project was generated using DayPilot UI Builder. It creates a HTML5/JavaScript project with a pre-configured Gantt chart JavaScript component.
We will modify the project to load a set of four tasks using tasks.list property.
<script>
  var dp = new DayPilot.Gantt("dp", {
    // ...
  });
  dp.tasks.list = [
    {
      id: 1,
      start: DayPilot.Date.today().firstDayOfMonth().addDays(3),
      end: DayPilot.Date.today().firstDayOfMonth().addDays(10),
      text: "Task 1",
      complete: 60
    },
    {
      id: 2,
      start: DayPilot.Date.today().firstDayOfMonth().addDays(10),
      end: DayPilot.Date.today().firstDayOfMonth().addDays(15),
      text: "Task 2",
      complete: 0
    },
    {
      id: 3,
      start: DayPilot.Date.today().firstDayOfMonth().addDays(15),
      type: "Milestone",
      text: "Milestone 1"
    },
    {
      id: 4,
      start: DayPilot.Date.today().firstDayOfMonth().addDays(15),
      end: DayPilot.Date.today().firstDayOfMonth().addDays(23),
      text: "Task 4",
      complete: 50
    },
  ];
  dp.init();
</script>
We want to display additional data in the row header on the left side. The columns headers and content can be defined using columns property.
Our Gantt chart instance will display additional task details in three columns:
Name
Id
Complete
We will also customize the content of the third "Complete" column using onBeforeRowHeaderRender. It will display the progress as a percentage.
<script>
  var dp = new DayPilot.Gantt("dp", {
    columns: [
      { name: "Name", display: "text"},
      { name: "ID", display: "id"},
      { name: "Complete", display: "complete", width: 100},
    ],
    onBeforeRowHeaderRender: function(args) {
        if (typeof args.task.data.complete === "number") {
          args.row.columns[2].html = args.task.data.complete + "%";
        }
    },
  });
  dp.tasks.list = [
    {
      id: 1,
      start: DayPilot.Date.today().firstDayOfMonth().addDays(3),
      end: DayPilot.Date.today().firstDayOfMonth().addDays(10),
      text: "Task 1",
      complete: 60
    },
    {
      id: 2,
      start: DayPilot.Date.today().firstDayOfMonth().addDays(10),
      end: DayPilot.Date.today().firstDayOfMonth().addDays(15),
      text: "Task 2",
      complete: 0
    },
    {
      id: 3,
      start: DayPilot.Date.today().firstDayOfMonth().addDays(15),
      type: "Milestone",
      text: "Milestone 1"
    },
    {
      id: 4,
      start: DayPilot.Date.today().firstDayOfMonth().addDays(15),
      end: DayPilot.Date.today().firstDayOfMonth().addDays(23),
      text: "Task 4",
      complete: 50
    },
  ];
  dp.init();
</script>
Context Menu for Hiding Gantt Chart Columns
![]()
In this step, we will add an icon to the upper-left corner that will display a context menu. This context menu lets users hide or show selected columns.
The icon can be added as an active area using onBeforeCornerRender event handler.
<script>
  var dp = new DayPilot.Gantt("dp", {
    // ...
    onBeforeCornerRender: function(args) {
      return;
      args.areas = [
        {
          right: 5,
          top: 5,
          height: 20,
          width: 20,
          action: "ContextMenu",
          icon: "icon icon-menu",
          cssClass: "area-open-menu",
          menu: new DayPilot.Menu({
            onShow: function(args) {
              var menu = this;
              menu.items = [];
              var visibleColumns = dp.columns.filter(function(column) { return !column.hidden; });
              dp.columns.forEach(function(column) {
                var thisIsTheLastVisibleColumn = visibleColumns.length === 1 && !column.hidden;
                menu.items.push({
                  text: column.name,
                  icon: column.hidden ? "" : "icon icon-checked",
                  disabled: thisIsTheLastVisibleColumn,
                  onClick: function(args) {
                    // hide the menu immediately, normally it stays visible until onClick completes
                    menu.hide();
                    column.hidden = !column.hidden;
                    dp.update();
                  }
                });
              });
            }
          })
        }
      ]
    }
  });
  // ...
  dp.init();
</script>
The icons (menu icon and a check mark) used in the context menu are defined using CSS. They use UTF-8 icons.
  <style>
    i.icon { font-style: normal; }
    .icon-checked:before {
      content: '\2714';
    }
    .icon-menu:before {
      content: '\2BC6';
    }
    .gantt_default_main .area-open-menu {
      font-size: 14px;
      border: 1px solid #ccc;
      box-sizing: border-box;
      background-color: white;
      text-align: center;
      padding: 1px;
      cursor: pointer;
    }
  </style>
Full Source Code
<!DOCTYPE html>
<html>
<head>
  <meta charset="utf-8"/>
  <meta name="viewport" content="width=device-width, initial-scale=1">
  <title>JavaScript Gantt Chart: Show/Hide Columns using Context Menu</title>

  <style type="text/css">
    <!-- ... -->
  </style>

  <style>
    i.icon { font-style: normal; }
    .icon-checked:before {
      content: '\2714';
    }
    .icon-menu:before {
      content: '\2BC6';
    }
    .gantt_default_main .area-open-menu {
      font-size: 14px;
      border: 1px solid #ccc;
      box-sizing: border-box;
      background-color: white;
      text-align: center;
      padding: 1px;
      cursor: pointer;
    }
  </style>

  <!-- DayPilot library -->
  <script src="js/daypilot/daypilot-all.min.js"></script>
</head>
<body>
<div class="header">
  <h1><a href='https://code.daypilot.org/83592/javascript-gantt-chart-show-hide-columns-using-context-menu'>JavaScript Gantt Chart: Show/Hide Columns using Context Menu</a></h1>
  <div><a href="https://javascript.daypilot.org/">DayPilot for JavaScript</a> - HTML5 Calendar/Scheduling Components for JavaScript/Angular/React</div>
</div>

<div class="main">
  <div id="dp"></div>
</div>

<script>
  var dp = new DayPilot.Gantt("dp", {
    cellWidthSpec: "Fixed",
    cellWidth: 40,
    timeHeaders: [{"groupBy":"Month"},{"groupBy":"Day","format":"d"}],
    scale: "Day",
    days: DayPilot.Date.today().daysInMonth(),
    startDate: DayPilot.Date.today().firstDayOfMonth(),
    taskHeight: 30,
    rowHeaderHideIconEnabled: true,
    rowCreateHandling: "Enabled",
    onRowCreate: function (args) {
      this.tasks.add(new DayPilot.Task({
        id: DayPilot.guid(),
        text: args.text,
        start: new DayPilot.Date().getDatePart(),
        end: new DayPilot.Date().getDatePart().addDays(1)
      }));
    },
    columns: [
      { name: "Name", display: "text"},
      { name: "ID", display: "id"},
      { name: "Complete (%)", display: "complete", width: 100},
    ],
    onBeforeRowHeaderRender: function(args) {
        if (typeof args.task.data.complete === "number") {
          args.row.columns[2].html = args.task.data.complete + "%";
        }
    },
    onBeforeCornerRender: function(args) {
      args.areas = [
        {
          right: 5,
          top: 5,
          height: 20,
          width: 20,
          action: "ContextMenu",
          icon: "icon icon-menu",
          cssClass: "area-open-menu",
          menu: new DayPilot.Menu({
            onShow: function(args) {
              var menu = this;
              menu.items = [];
              var visibleColumns = dp.columns.filter(function(column) { return !column.hidden; });
              dp.columns.forEach(function(column) {
                var thisIsTheLastVisibleColumn = visibleColumns.length === 1 && !column.hidden;
                menu.items.push({
                  text: column.name,
                  icon: column.hidden ? "" : "icon icon-checked",
                  disabled: thisIsTheLastVisibleColumn,
                  onClick: function(args) {
                    // hide the menu immediately, normally it stays visible until onClick completes
                    menu.hide();
                    column.hidden = !column.hidden;
                    dp.update();
                  }
                });
              });
            }
          })
        }
      ]
    }
  });
  dp.tasks.list = [
    {
      id: 1,
      start: DayPilot.Date.today().firstDayOfMonth().addDays(3),
      end: DayPilot.Date.today().firstDayOfMonth().addDays(10),
      text: "Task 1",
      complete: 60
    },
    {
      id: 2,
      start: DayPilot.Date.today().firstDayOfMonth().addDays(10),
      end: DayPilot.Date.today().firstDayOfMonth().addDays(15),
      text: "Task 2",
      complete: 0
    },
    {
      id: 3,
      start: DayPilot.Date.today().firstDayOfMonth().addDays(15),
      type: "Milestone",
      text: "Milestone 1"
    }
  ];
  dp.links.list = [
    {from: 1, to: 2, type: "FinishToStart"}
  ];
  dp.init();
</script>

</body>
</html>