DayPilot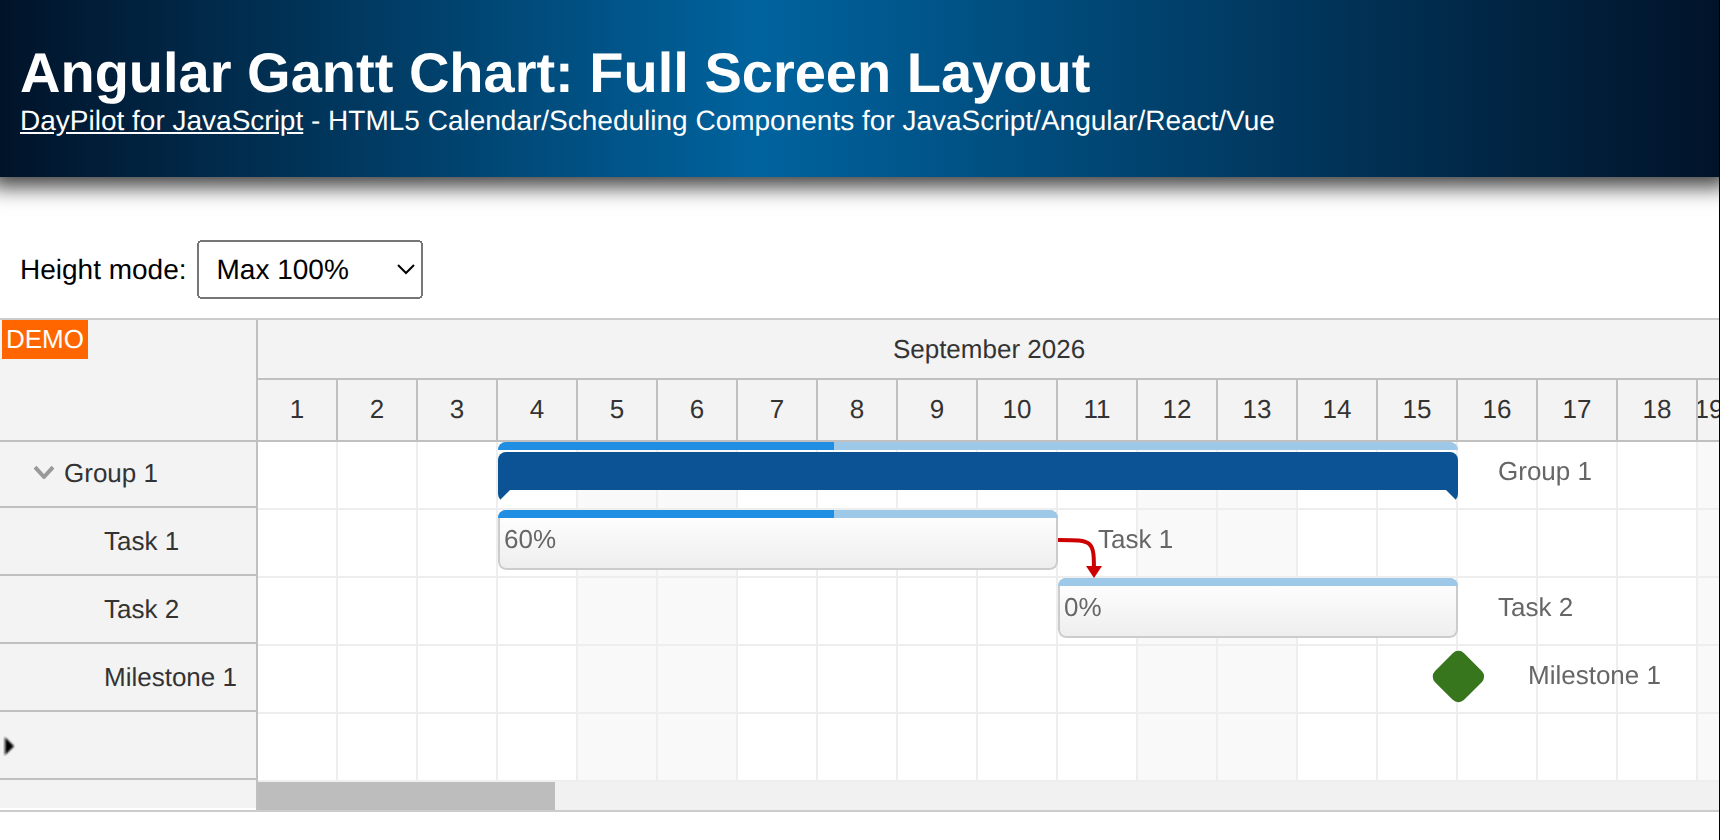
| Demo | |
|---|---|
| Downloads | |
| Languages | TypeScript |
| Technologies | angular |
Overview
-
How to make the Angular Gantt chart component from DayPilot Pro for JavaScript fill the available space with the
Parent100Pctmode. -
Let the Gantt chart grow according to content until it fills the available space with the
Max100Pctmode. -
For an introduction to using the Angular Gantt chart component, please see the Angular Gantt Chart Component (TypeScript + PHP/MySQL) tutorial.
License
Licensed for testing and evaluation purposes. Please see the license agreement included in the sample project. You can use the source code of the tutorial if you are a licensed user of DayPilot Pro for JavaScript.
How to integrate the Angular Gantt chart into a page with full-screen layout
You can control the height and vertical scrollbar of the Angular Gantt chart component using the heightSpec property. Here are the most common settings:
-
The default value of the heightSpec property of the Gantt chart component is
"Max". In this mode, the Gantt chart height will grow automatically according to the content until it reaches the height value. -
If you use the
"Auto"value, the height will grow automatically without limitations. This mode doesn’t allow fixing the Gantt chart header and the whole Gantt chart component will scroll with the page.
In this tutorial, you will see how to use the "Parent100Pct" and "Max100Pct" modes to integrate the Gantt chart into a full-screen page layout.
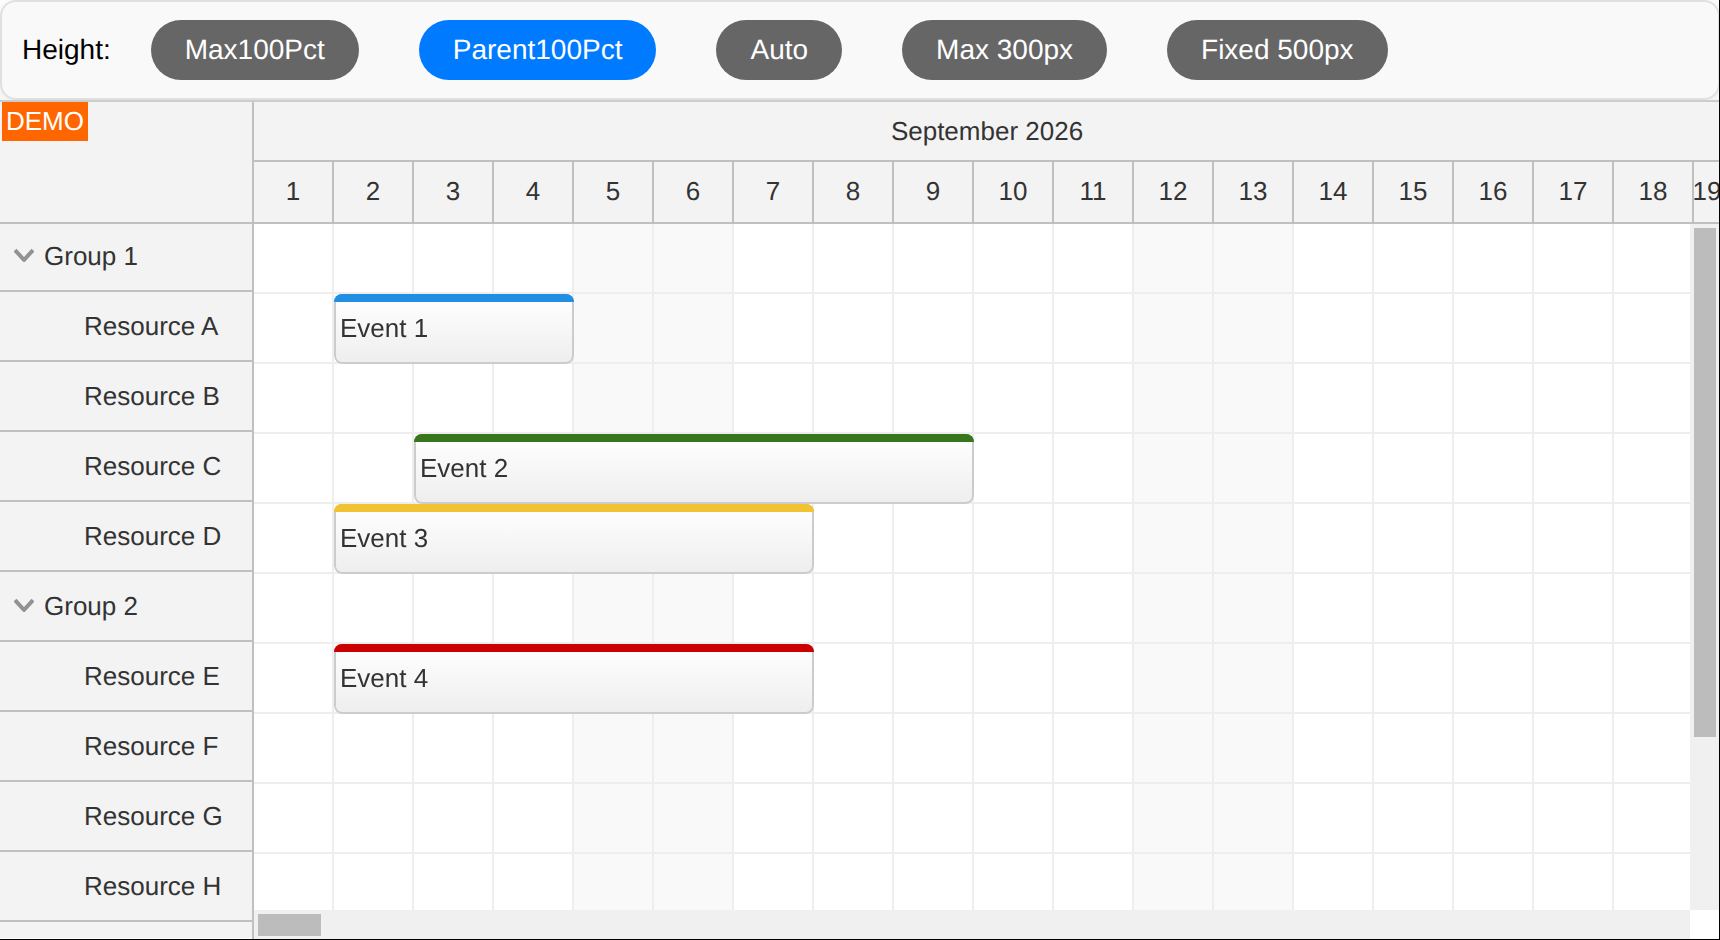
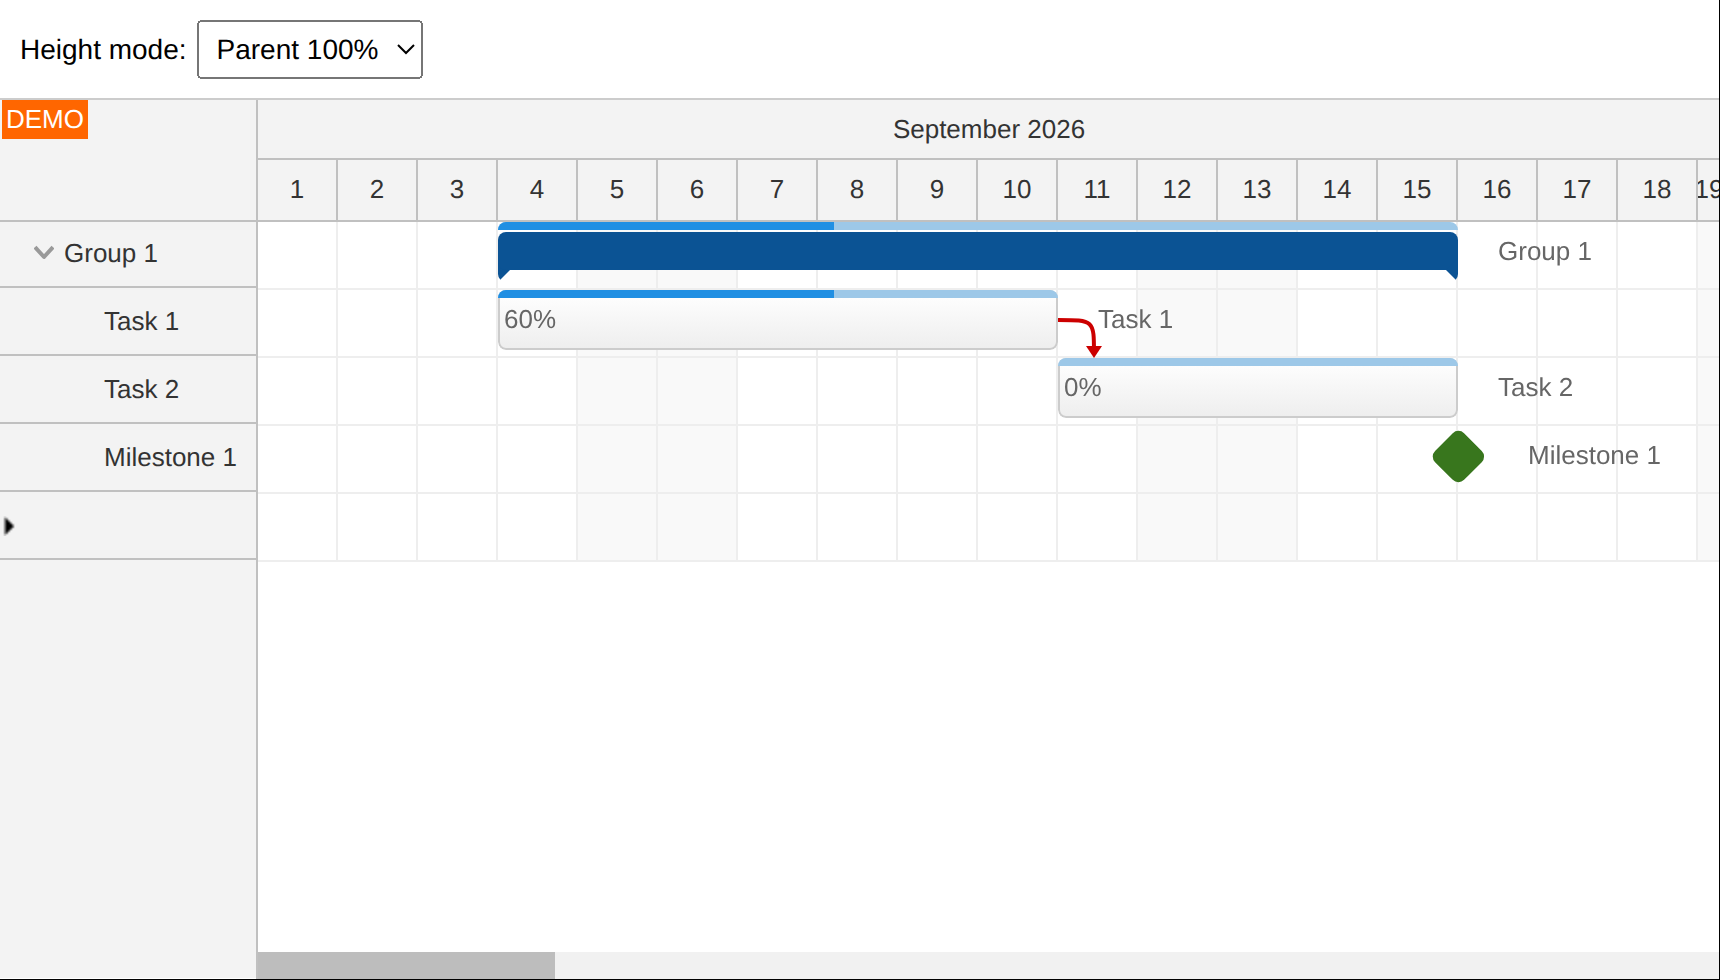
If you use heightSpec: "Parent100Pct" the Gantt chart will automatically adjust its height to fill the available space. The available space must be predefined by setting fixed dimensions for the parent <div> element.
The standalone Gantt component in src/app/gantt/gantt.component.ts uses the following template. The config, tasks, and links bindings are Angular signals:
<div class="fullscreen">
  <!-- ... -->
  <div class="main-body">
    <daypilot-gantt [config]="config" [tasks]="tasks" [links]="links" #gantt></daypilot-gantt>
    <!-- ... -->
  </div>
</div>
Use CSS to position the fullscreen container so that it won’t scroll with the page. Set position to absolute and define its edges using left, top, right, and bottom. The sample reserves 110 pixels above the container for the page header. Inside it, main-body reserves another 50 pixels for the height selector. Set these top offsets to zero if you don’t need the header or selector.
.fullscreen {
  position: absolute; top: 110px; left: 0px; right: 0px; bottom: 0px;
}
/* ... */
.main-body {
  position: absolute; left: 0px; right: 0px; top: 50px; bottom: 0px; overflow: hidden;
}
Select Parent 100% to enable Parent100Pct. The selector calls setHeightMode(), which updates the configuration signal. This notifies the Gantt component when the height mode changes:
setHeightMode(heightSpec: "Parent100Pct" | "Max100Pct"): void {
  this.config.update(config => ({ ...config, heightSpec }));
}
These settings extend the Gantt chart to the bottom of the browser viewport while leaving room for the header and selector. The horizontal scrollbar is placed at the bottom of the available space, even when the chart displays only a few rows. Its appearance and visibility depend on the browser and operating system.
How to auto-grow the Gantt chart height until 100% of the parent is reached
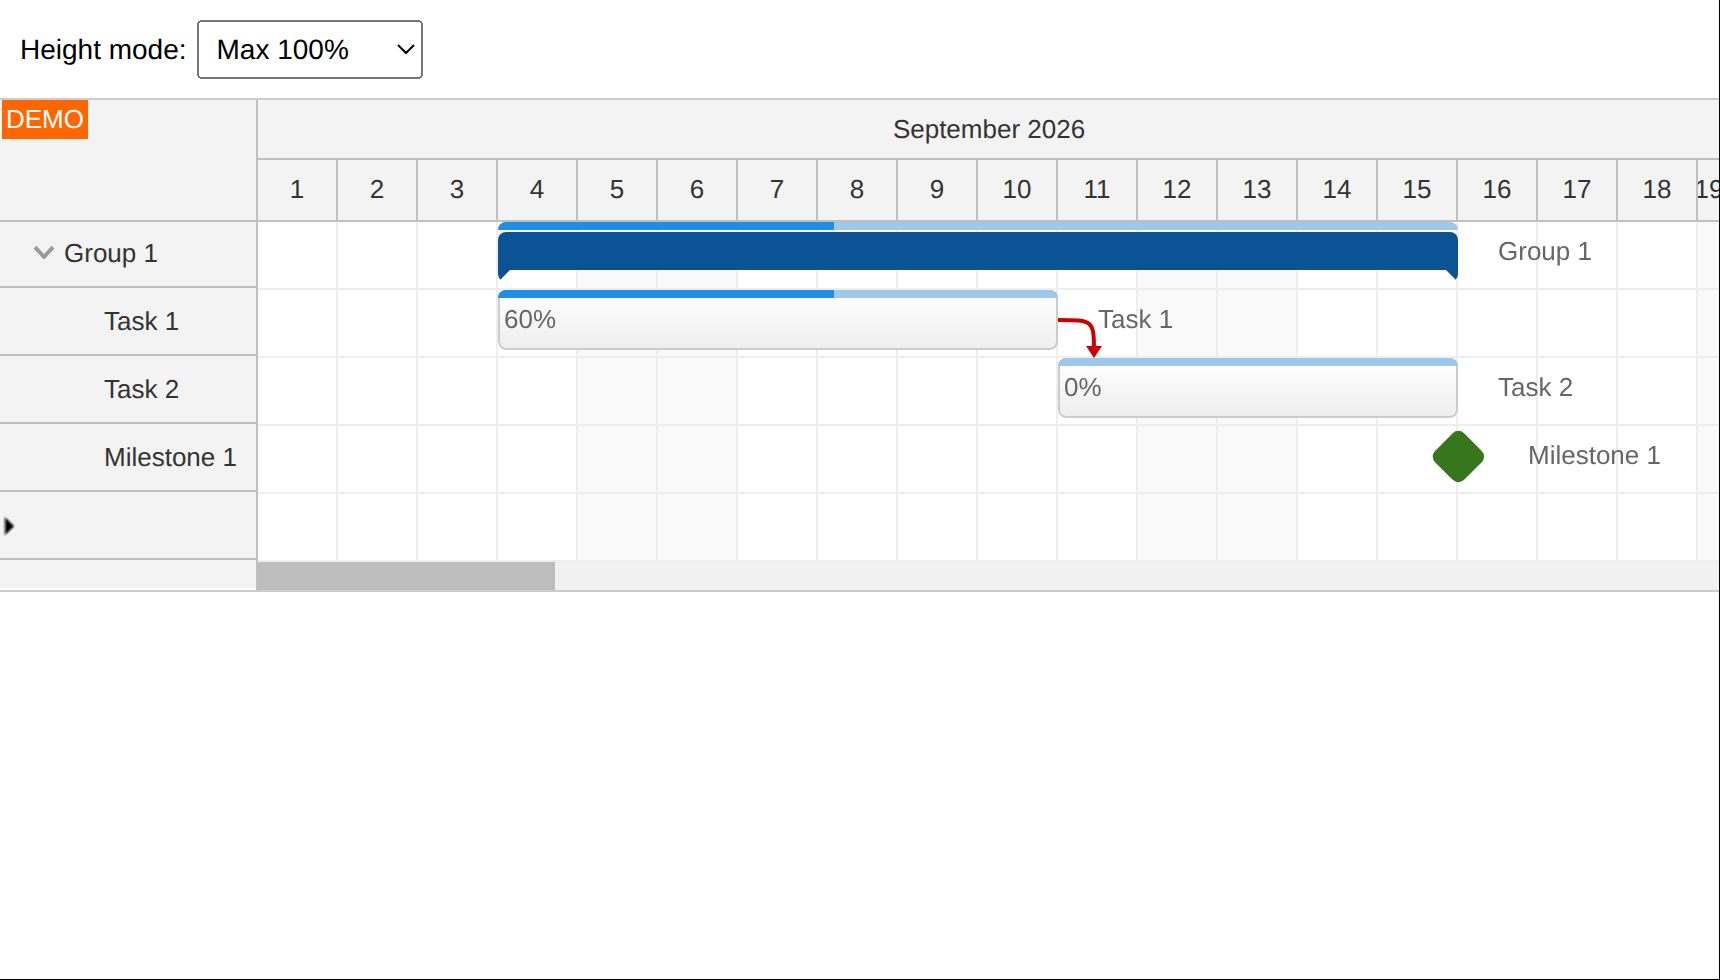
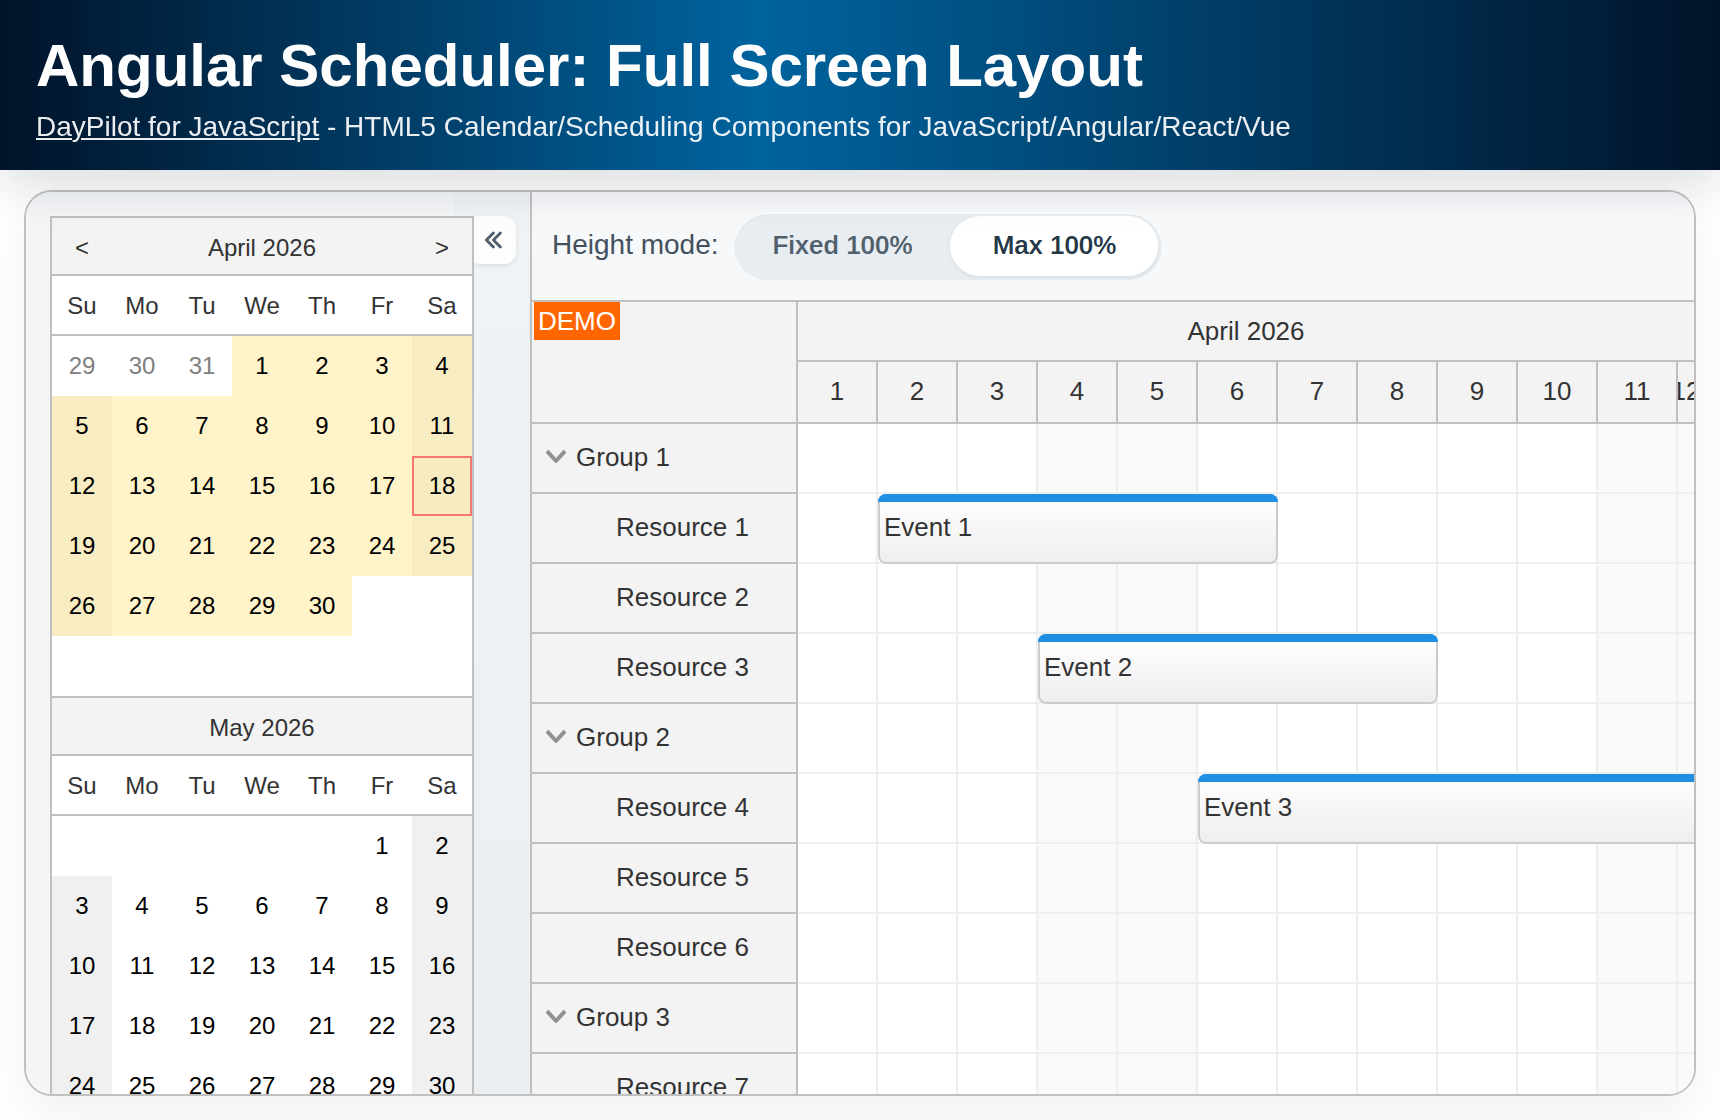
The "Max100Pct" mode behaves like the "Auto" mode until the height reaches the parent height. The sample starts in this mode; you can return to it using Max 100% in the selector.
config = signal<DayPilot.GanttConfig>({
  // ...
  heightSpec: "Max100Pct",
  // ...
});
In this case, the horizontal scrollbar sits below the rows, including the new-task row in this sample. As you add tasks, the chart grows until it reaches the parent height; additional rows then scroll inside the chart while the time headers stay visible.
How to hide the Gantt chart borders in the full screen mode to make integration easier
The default CSS theme includes a border around the whole Gantt chart component. In the full-screen mode, this is not always desirable. The Gantt chart component includes a special property (hideBorderFor100PctHeight) that lets you hide the border easily. Another option is to create a custom theme without the border specified.
config = signal<DayPilot.GanttConfig>({
  // ...
  heightSpec: "Max100Pct",
  hideBorderFor100PctHeight: true,
  // ...
});
For the Max100Pct mode, you may want to add a bottom border. The following example adds the border using a separate div immediately after the Gantt component. The parent uses overflow: hidden, so the border is clipped when the chart fills the parent:
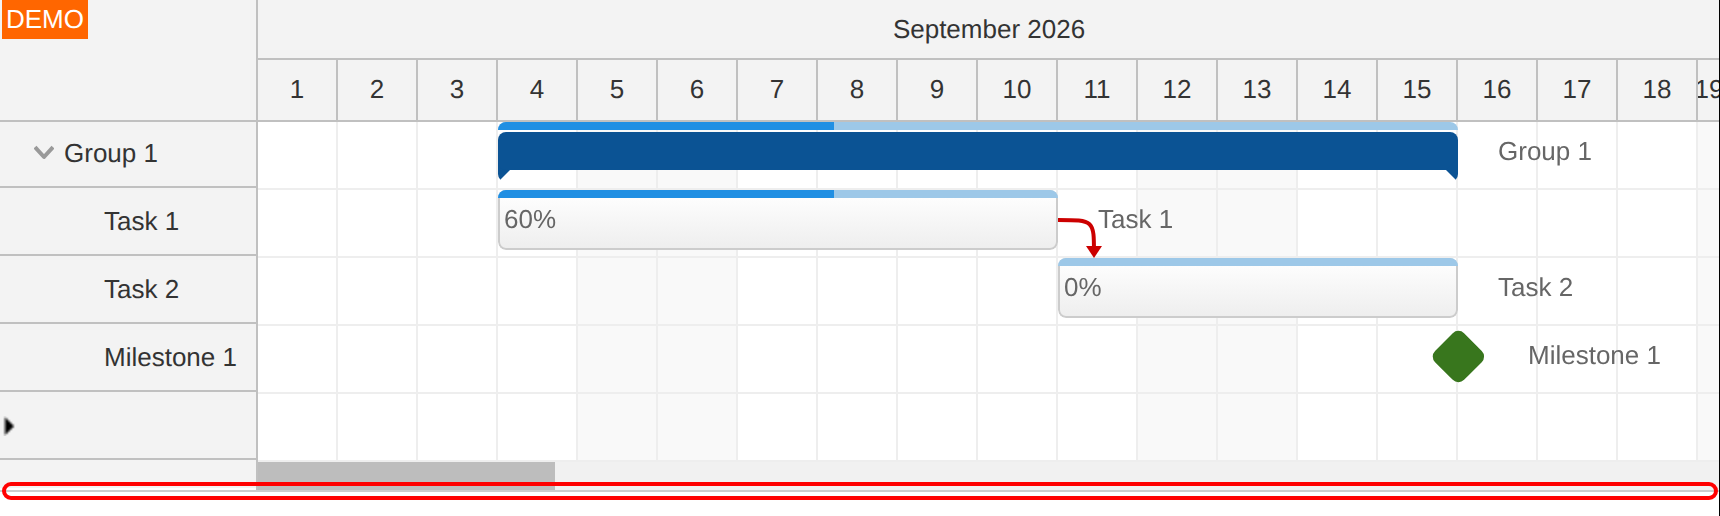
HTML template
<div class="main-body">
  <daypilot-gantt [config]="config" [tasks]="tasks" [links]="links" #gantt></daypilot-gantt>
  <div class="main-bottom"></div>
</div>
Styles:
.main-body {
  position: absolute; left: 0px; right: 0px; top: 50px; bottom: 0px; overflow: hidden;
}
.main-bottom {
  border-top: 1px solid #ccc;
}