DayPilot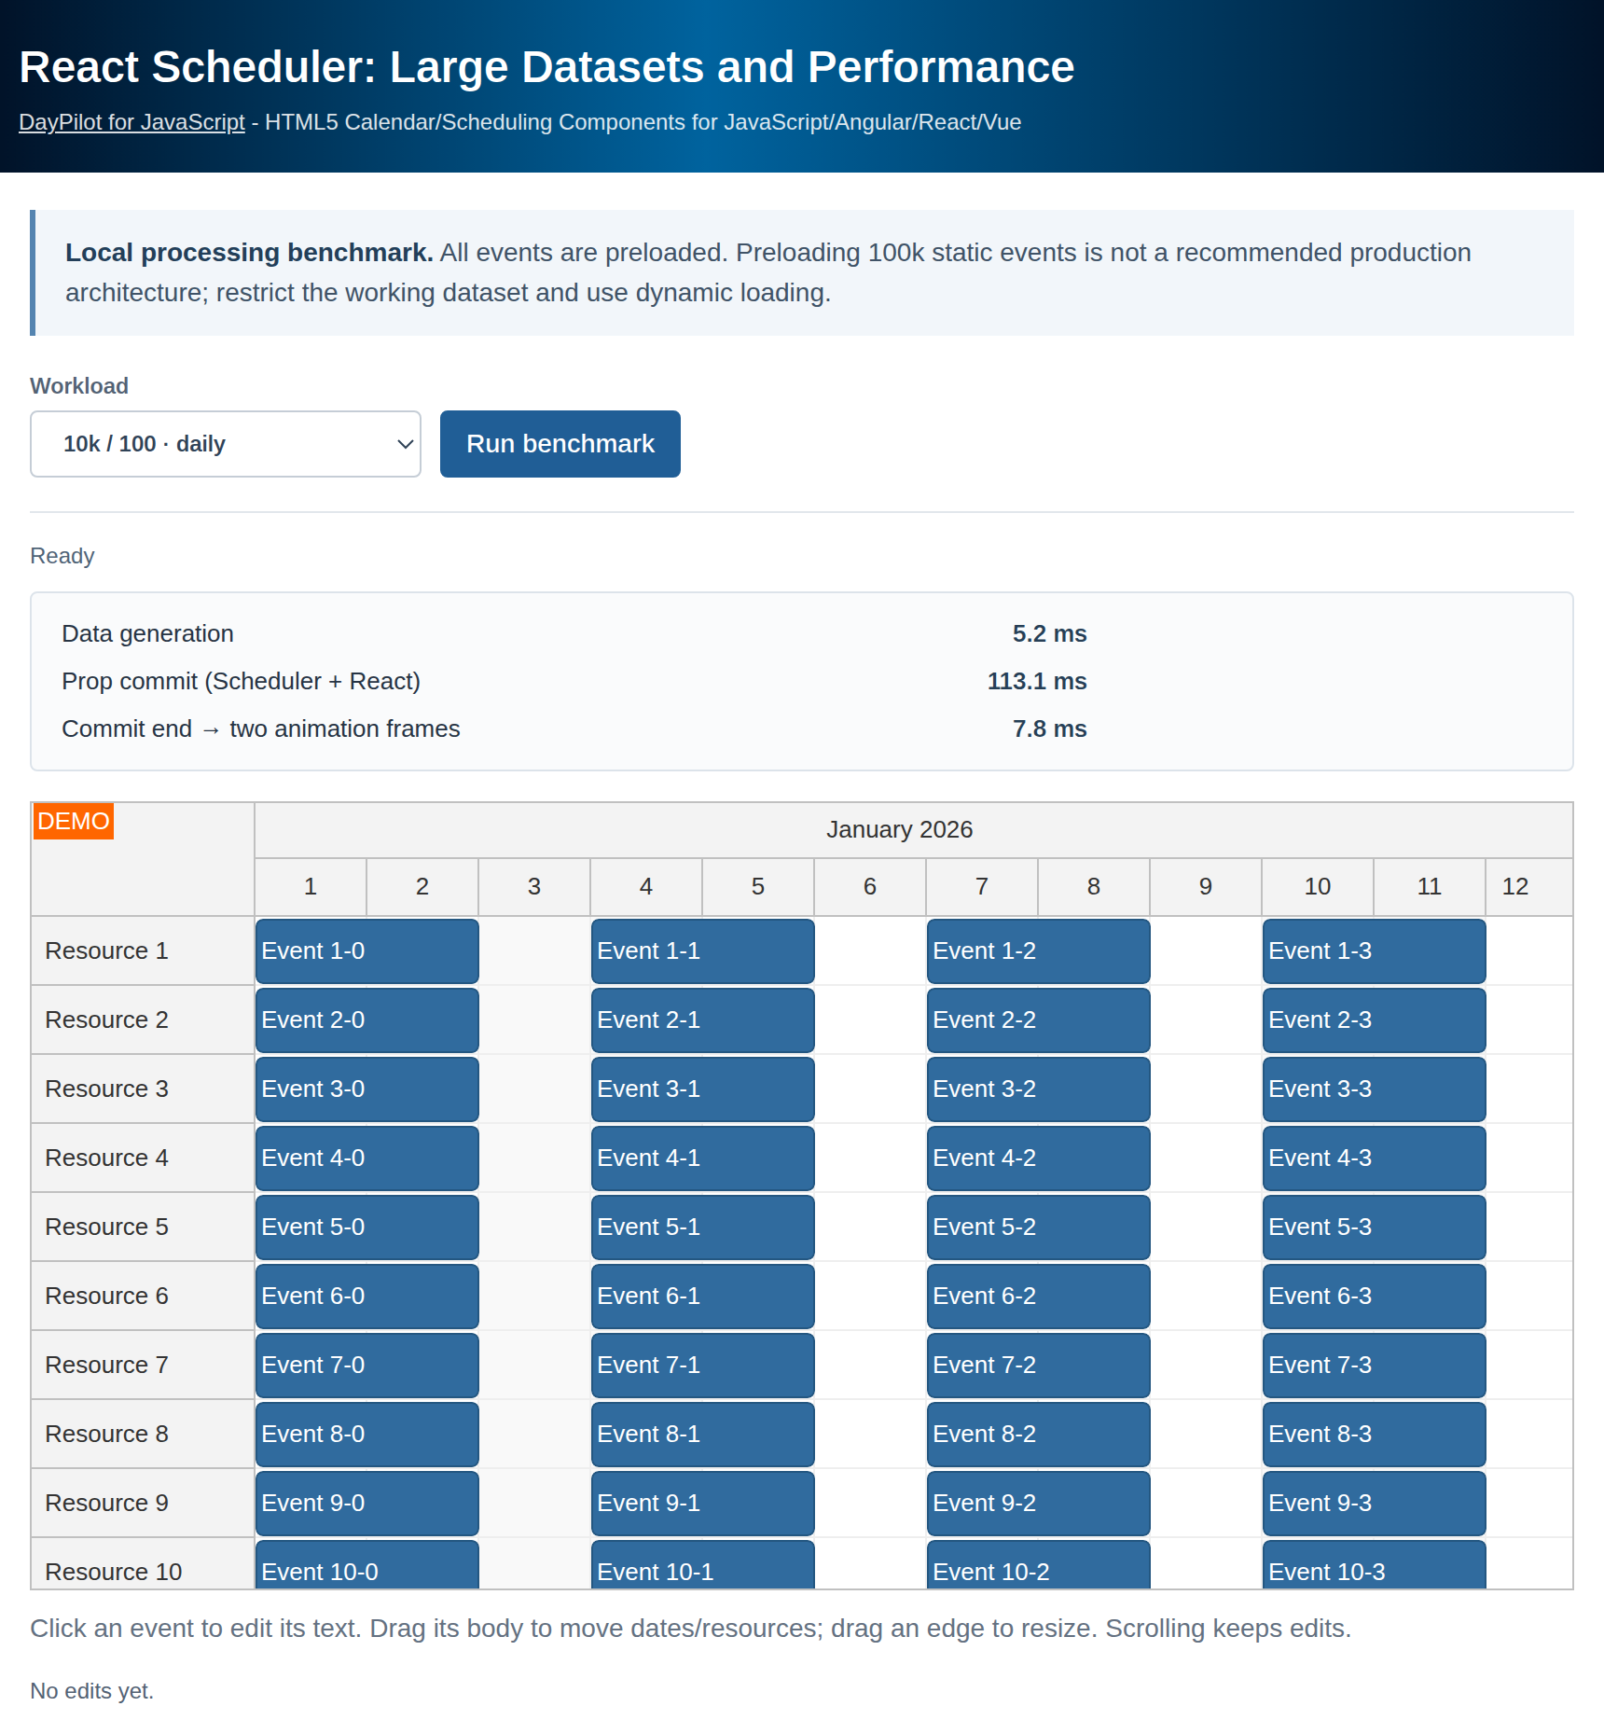
| Demo | |
|---|---|
| Downloads | |
| Languages | JavaScript |
| Technologies | React |
Overview
- Download the attached React project to see how the React Scheduler handles 10,000, 50,000 and 100,000 events, and test editing as well as loading.
- Compare daily and hourly timelines, inspect separate loading measurements, and scroll through records without discarding edits.
- Review the critical configuration options and practical performance checklist below.
- Includes a trial version of DayPilot Pro for JavaScript (see License below).
This is a client-side processing benchmark. Preloading 100,000 static events is not the recommended production architecture. In data-heavy applications, restrict the working dataset and use dynamic event loading. A backend implementation is outside this tutorial's scope.
License
Licensed for testing and evaluation purposes. Please see the license agreement included in the sample project. You can use the source code of the tutorial if you are a licensed user of DayPilot Pro for JavaScript.
React Scheduler with Large Datasets: Reference Implementation
The sample deliberately loads all events into the browser so you can examine local Scheduler processing, scrolling and editing. It does not measure server queries or network transfer, and its controlled event distribution is not a substitute for your own data.
- Dynamic event loading is disabled so that the complete generated collection remains loaded.
- Progressive event rendering is enabled: the Scheduler renders events around the viewport and prepares additional elements while scrolling. This reduces rendered DOM elements, not the number of loaded events.
- Event rendering during scrolling is debounced; see the scrolling performance guide.
Run a benchmark
Install the sample dependencies with npm install and start the development server with npm run dev. For performance comparisons, use npm run build followed by npm run preview so development checks do not affect the results.
A fresh visit automatically loads 10,000 events across 100 resources. Choose another workload and click Run benchmark to load it. Selecting an option alone does not generate data. The largest workload is never restored from a previous visit.
- Daily, default: 10,000 events, 100 resources, 365 timeline columns.
- Daily, larger: 50,000 events, 500 resources, 365 timeline columns.
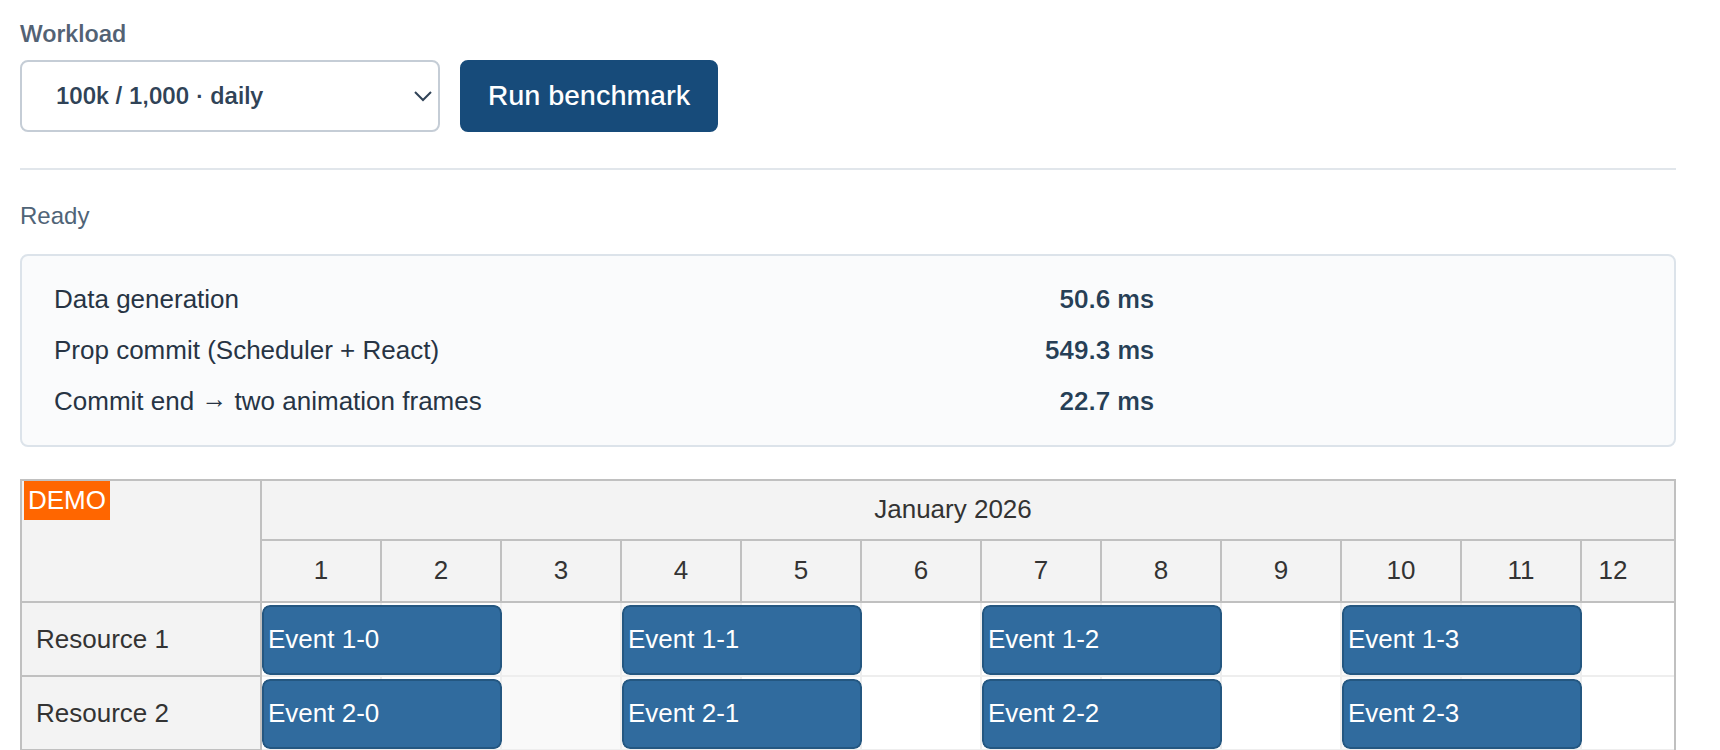
- Daily, largest: 100,000 events, 1,000 resources, 365 timeline columns.
- Hourly, optional: 10,000 events, 100 resources, 8,760 timeline columns.
Event and resource counts increase together in the daily profiles. Each resource has 100 events. Consequently, these choices do not isolate the cost of increasing event count alone. The daily scale uses one cell per day over 365 days: the largest daily profile describes a 365 × 1,000 grid, but that is not a count of DOM elements.
Generate repeatable data
Every run uses the fixed year 2026 and the same IDs and dates. Daily events last two days and begin every three days; hourly events use the same start dates but last four hours. There are no random inputs or saved selections. This mostly non-overlapping distribution keeps the benchmark controlled; dense overlaps, custom content and different durations can change the result.
Rerunning or switching a benchmark regenerates the entire dataset and resets edits. Scrolling does neither. The generator in src/scheduler/data.js creates the resources and events together:
export function generate(profile) {
  const resources = [];
  const events = [];
  const first = new DayPilot.Date(startDate);
  for (let row = 1; row <= profile.resources; row++) {
    resources.push({id: `r${row}`, name: `Resource ${row}`});
    for (let slot = 0; slot < 100; slot++) {
      const start = first.addDays(slot * 3);
      events.push({
        id: `e${row}-${slot}`,
        resource: `r${row}`,
        start,
        end: profile.hourly ? start.addHours(4) : start.addDays(2),
        text: `Event ${row}-${slot}`,
      });
    }
  }
  return {resources, events};
}
What Scheduler Loading Times Can You Expect?
Load diagnostics remain visible above the Scheduler. The sample separates three measurements:
- Data generation: the time spent constructing resource and event records outside the Scheduler.
-
Prop commit (Scheduler + React): the interval from the measuring wrapper’s
getSnapshotBeforeUpdate()to itscomponentDidUpdate(). It encloses the child Scheduler wrapper’s synchronousupdate(props)processing plus React commit overhead. It excludes React scheduling and render work before the snapshot, and is not completed rendering time. - Commit end → two animation frames: a short observation window after that commit boundary. It is not a rendering-complete notification; deferred event/header rendering, browser painting and later scrolling work may fall outside it.
The shell and loading message get a paint opportunity before synchronous generation begins. The same two-frame helper is used after the measured commit, but it does not turn synchronous work into background work: a large run can still block the main thread.
const afterPaintOpportunity = () => new Promise(resolve => {
  requestAnimationFrame(() => requestAnimationFrame(resolve));
});
One setDataset() call stores events, resources, scale and time headers together. React then delivers a consistent configuration through props. Timing the setter alone would miss the Scheduler work, so the sample measures the subsequent commit.
const run = useCallback(async profile => {
    if (busy.current || !control.current) return;
    busy.current = true;
    setLoading(true);
    setStatus(`Loading ${profile.events.toLocaleString()} events / ${profile.resources.toLocaleString()} resources…`);
    setEditor(null);
    try {
      // Give the shell and loading state a paint opportunity before blocking work.
      await afterPaintOpportunity();
      const begin = performance.now();
      const data = generate(profile);
      const generated = performance.now();
      setDataset({
        ...data,
        scale: profile.hourly ? 'Hour' : 'Day',
        timeHeaders: profile.hourly ? hourlyHeaders : dailyHeaders,
        generation: generated - begin,
      });
    } catch (error) {
      setStatus(`Benchmark failed: ${error.message}`);
      setLoading(false);
      busy.current = false;
    }
  }, []);
Use the values to locate work, not to rank browser responsiveness from a single number. Record the browser, viewport, CPU setting and workload, repeat runs, and test interactions separately. Neither a short update call nor a small rendered DOM proves low total memory use or fast editing.
Editing the Loaded Dataset
Click an event to open the small text editor. Save updates that record; Cancel discards the text draft. Drag the event body to another date or resource, or drag an edge to resize it. Native Scheduler moving and resizing update the individual event.
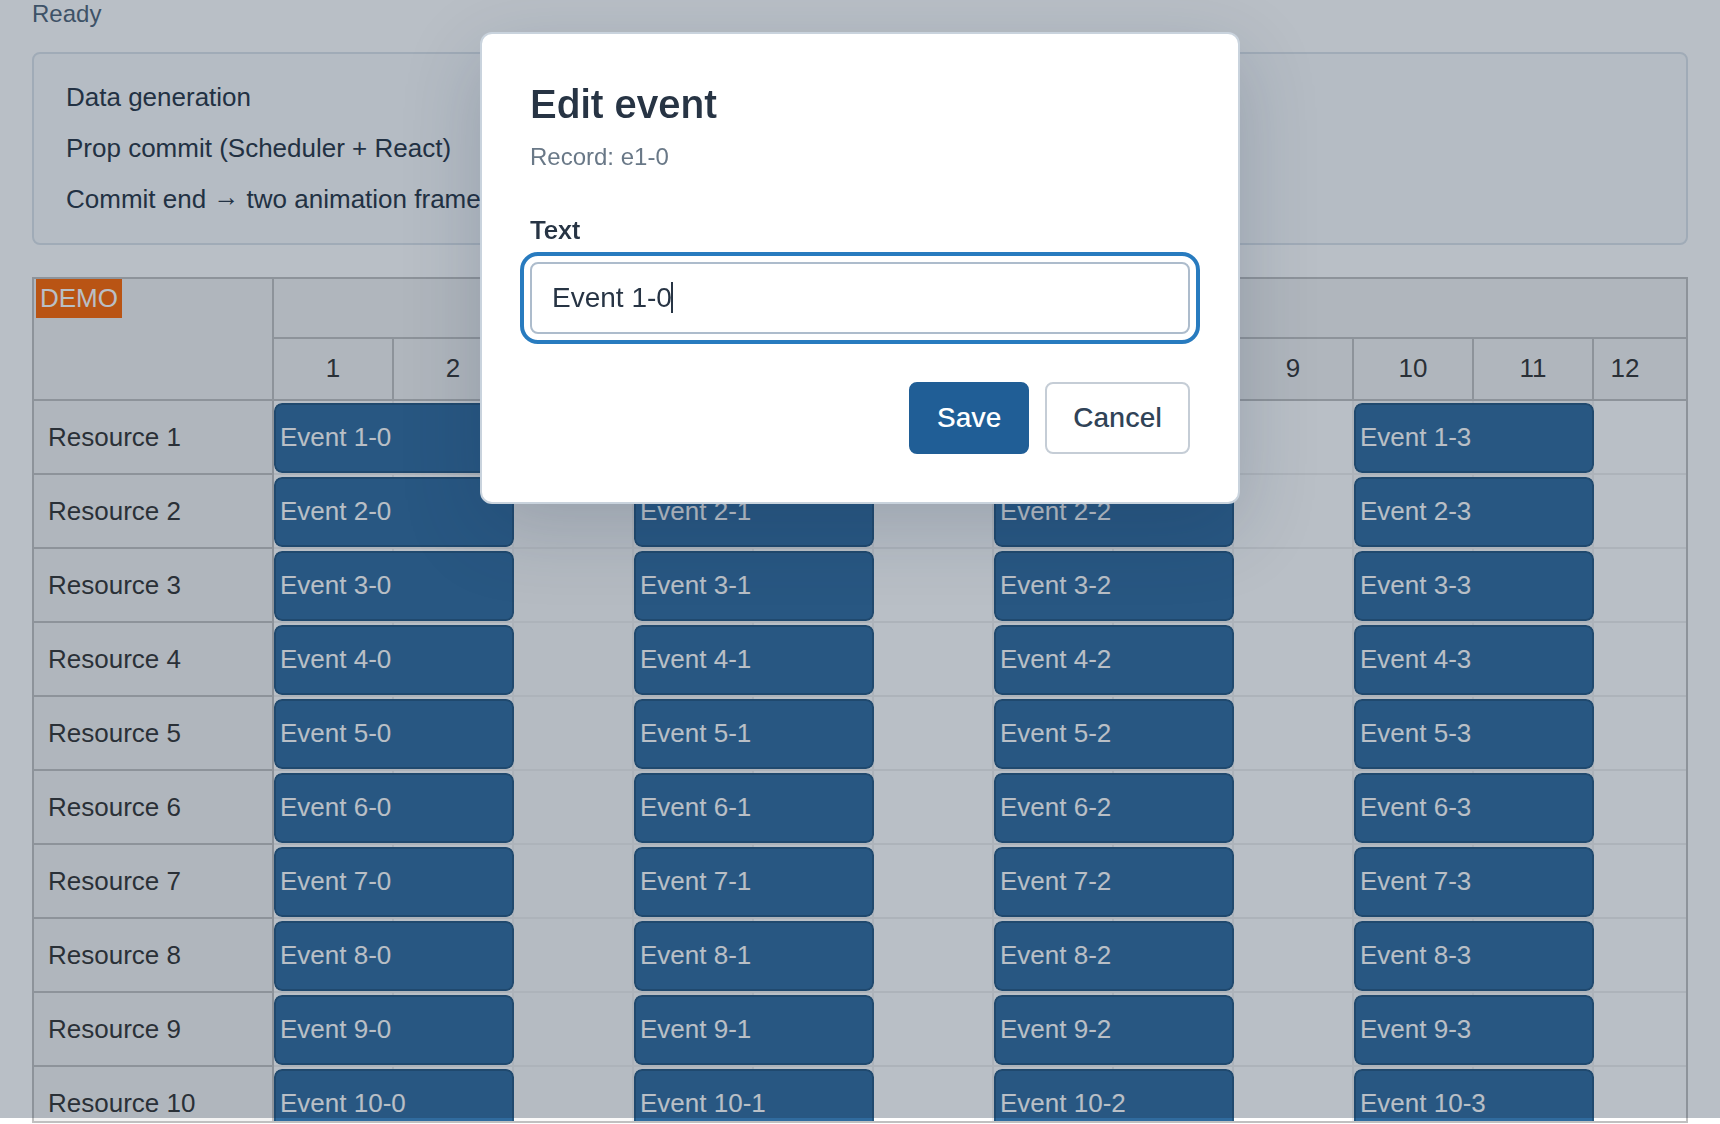
Scroll to later dates and other resources to try editing throughout the dataset. Scrolling away and back preserves changes until the next benchmark run or page reload.
React state holds the bulk dataset supplied through events and resources props. Storing these collections in state does not require replacing them for every edit. Between deliberate loads, the sample keeps those references stable and uses the Scheduler’s live records for edits; the state object is a load snapshot, not an immutable mirror of every edited value. The editor keeps its draft text separately. Save finds the live record and calls events.update():
function save(event) {
    event.preventDefault();
    const e = control.current.events.find(editor);
    e.data.text = text.trim();
    control.current.events.update(e);
    onChanged({e});
    setEditor(null);
  }
The memoized grid receives stable callbacks created with useCallback; its time-header arrays are defined outside the component. Toolbar selections, diagnostics and typing in the editor therefore do not pass new configuration objects or event arrays to the Scheduler. Only a deliberate load replaces the dataset object. The React Scheduler wrapper then performs one full update; status, diagnostics, toolbar selections and editor typing leave the memoized grid unchanged.
class MeasuredScheduler extends Component {
  getSnapshotBeforeUpdate() {
    return performance.now();
  }

  componentDidUpdate(previousProps, previousState, started) {
    const finished = performance.now();
    this.props.onCommitted(this.props.dataset.generation, finished - started, finished);
  }

  render() {
    const {dataset, onReady, onEdit, onChanged} = this.props;
    return <DayPilotScheduler
    controlRef={onReady}
    startDate={startDate}
    days={365}
    events={dataset.events}
    resources={dataset.resources}
    scale={dataset.scale}
    timeHeaders={dataset.timeHeaders}
    scrollX={0}
    scrollY={0}
    cellWidth={60}
    rowHeaderWidth={120}
    rowMarginTop={1}
    rowMarginBottom={1}
    heightSpec="Fixed"
    height={360}
    durationBarVisible={false}
    progressiveTimeHeaderRendering={true}
    eventUpdateInplaceOptimization={true}
    eventMoveHandling="Update"
    eventResizeHandling="Update"
    eventClickHandling="Enabled"
    eventHoverHandling="Disabled"
    timeRangeSelectedHandling="Disabled"
    onEventClicked={onEdit}
    onEventMoved={onChanged}
    onEventResized={onChanged}
  />;
  }
}

// Only deliberate loads replace dataset; all callback references remain stable.
const BenchmarkGrid = memo(MeasuredScheduler);
eventUpdateInplaceOptimization is enabled. It allows a narrower update when a change does not affect other events. Do not assume that this makes moving or resizing fast: changing placement can require additional row processing. Test all interaction types with your own event distribution.
Observed interaction limits
The production build was exercised in headless Chrome on Linux at normal CPU speed and with Chrome's 4× CPU slowdown. All four exposed profiles passed opening the editor, Save and Cancel, native movement between dates/resources, resizing, distant navigation, return navigation and repeated text edits. The verification harness scrolled to distant records and back without adding navigation controls to the app. Counts stayed constant, edits survived toolbar changes and scrolling, and instrumentation found exactly one Scheduler update per deliberate load and none from unrelated state changes or individual edits. Independent call timing confirmed that the commit interval enclosed synchronous Scheduler processing.
The largest daily profile still showed noticeable delays under throttling. In one local run, its measured prop commit took about 1.9 seconds. Text Save through dialog closure and two animation frames took about 0.32–0.39 seconds; the interval from native mouse release through two frames was about 0.37–0.41 seconds for moves and 0.32–0.36 seconds for resizes. These are automated observation intervals with browser/automation overhead, not rendering-complete timings, full drag latency or a hardware-independent guarantee. They show why editing needs its own test even when loading looks acceptable.
The in-place option was enabled for every tested profile. These measurements do not establish a speedup against the option being disabled or against imperative bulk loading. The data is deliberately simple; richer content and denser overlaps may produce different limits.
Optional Hourly Benchmark and Progressive Time Headers
Select 10k / 100 · hourly and run it explicitly. This keeps the event/resource counts at the default size but expands the one-year timeline to 8,760 hourly columns. Event duration changes to four hours so native resizing is easy to inspect at that scale.
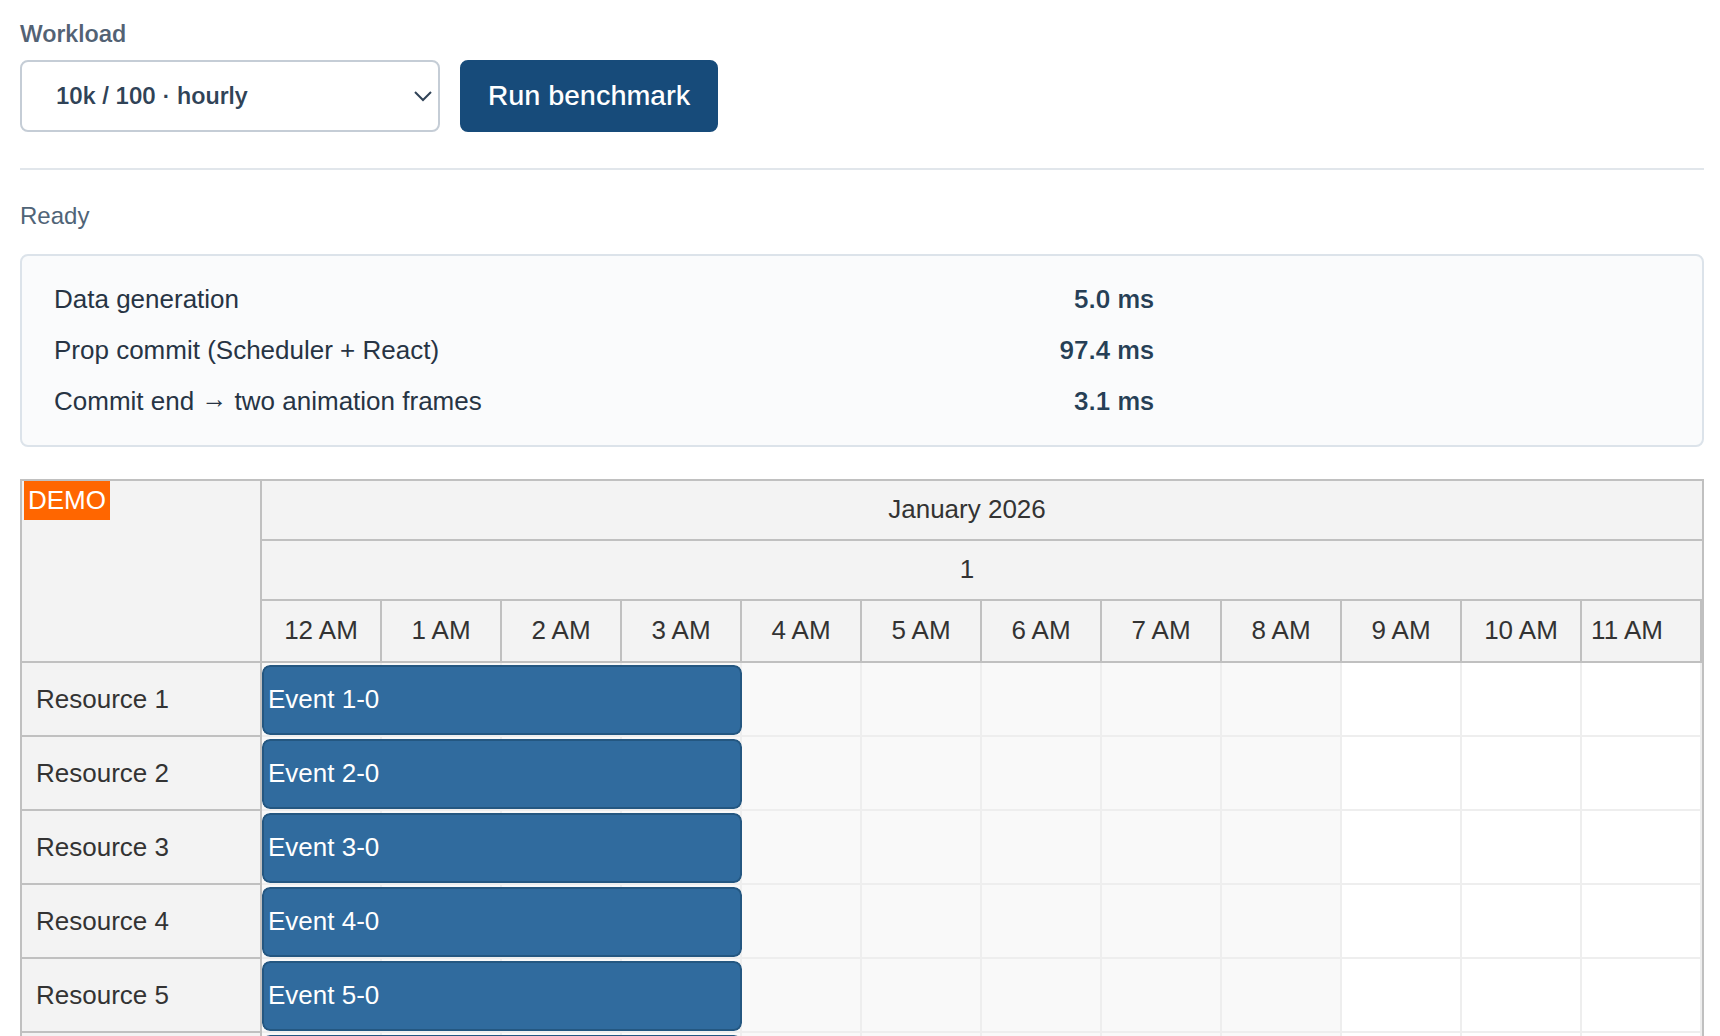
The 2026.4.7091 release includes progressive time headers and improvements to timeline initialization, event loading and scrolling. With progressiveTimeHeaderRendering enabled, headers are rendered as needed during navigation rather than creating all header elements initially. This is separate from progressive event rendering and does not unload event records.
Timeline resolution determines the number of time columns; resource count determines rows; event count determines the records to process; visible density determines how much content needs to be rendered in the viewport. These are separate dimensions. Here, the hourly profile also changes visible event density, so it is not a pure timeline-resolution comparison. Larger hourly workloads are intentionally not exposed: they would require their own loading, navigation and editing tests.
What to Do When It Takes a Long Time to Load the Scheduler?
1. First, you should check how long it takes to load the data from the server.
-
Check whether the database query is inefficient or loads much more data than needed. This client-side benchmark does not measure database or network time.
-
You should try to keep the data set as small as possible. A large data set will take a long time to generate, it will consume server resources and it will take a long time to send it over the network.
-
You can make the data set smaller by either restricting the view size (smaller date range, smaller number of resources) or by enabling dynamic event loading.
2. The next step is to check the rendering phase:
-
Make sure that the Scheduler viewport size is limited in both directions. Using
heightSpec="Auto"will display all resources and stretch the Scheduler viewport height to the maximum. This increases the visible work and reduces the benefit of rendering only the viewport. The sample uses a fixed 360-pixel Scheduler height. -
Check the Scheduler scale and cell width. Using small cells will result in a large number of cells in the viewport and slow down the rendering.
-
Check the total timeline size and resolution. Progressive time headers make long timelines more practical by limiting header DOM work, but timeline initialization and event processing still have costs. There is no universal 3,000-column cutoff: test the actual date range, scale, visible density and interactions. The hourly profile below uses 8,760 columns.
-
Check the rendering event handlers, especially onBeforeCellRender and onBeforeEventRender. These customization events are fired for every rendered cell and event, respectively, and any inefficiency will have a large impact. Try to pre-calculate the values before loading the data and only lookup the results in the rendering events (if possible).
-
Try to limit the number of custom elements displayed in cells and events (when using raw HTML or active areas). Rich object structure will increase the DOM size and the time needed to render the content.
See also the list of the most common mistakes that hurt the Scheduler performance.
What to Do When the Scrolling Performance Is Poor?
In most cases, this is caused by too much content that needs to be moved or rendered during scrolling.
There is a special guide focused on scrolling performance that will provide additional hints.