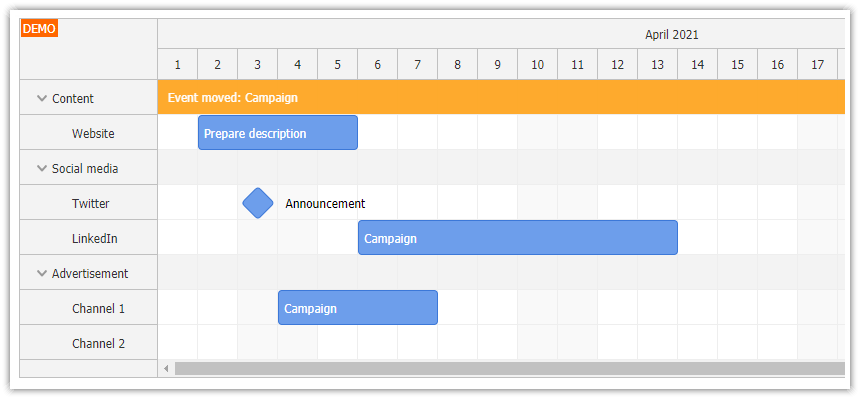
The Scheduler time headers can display multiple rows with different group sizes, custom HTML, and fully custom graphics drawn using active areas.
The sample project includes a small toolbar that switches between the exact configurations shown in this tutorial, so you can compare the built-in grouping options with progressively more advanced custom rendering.
Features
Custom time header formatting in DayPilot Pro JavaScript Scheduler
Examples that replace the default time header content or add time-positioned active areas
Downloadable JavaScript/HTML5 project based on the current builder template, including the latest DayPilot Pro trial bundle
License
Licensed for testing and evaluation purposes. Please see the LICENSE.md file included in the sample project. You can use the source code of this tutorial if you are a licensed user of DayPilot Pro for JavaScript.
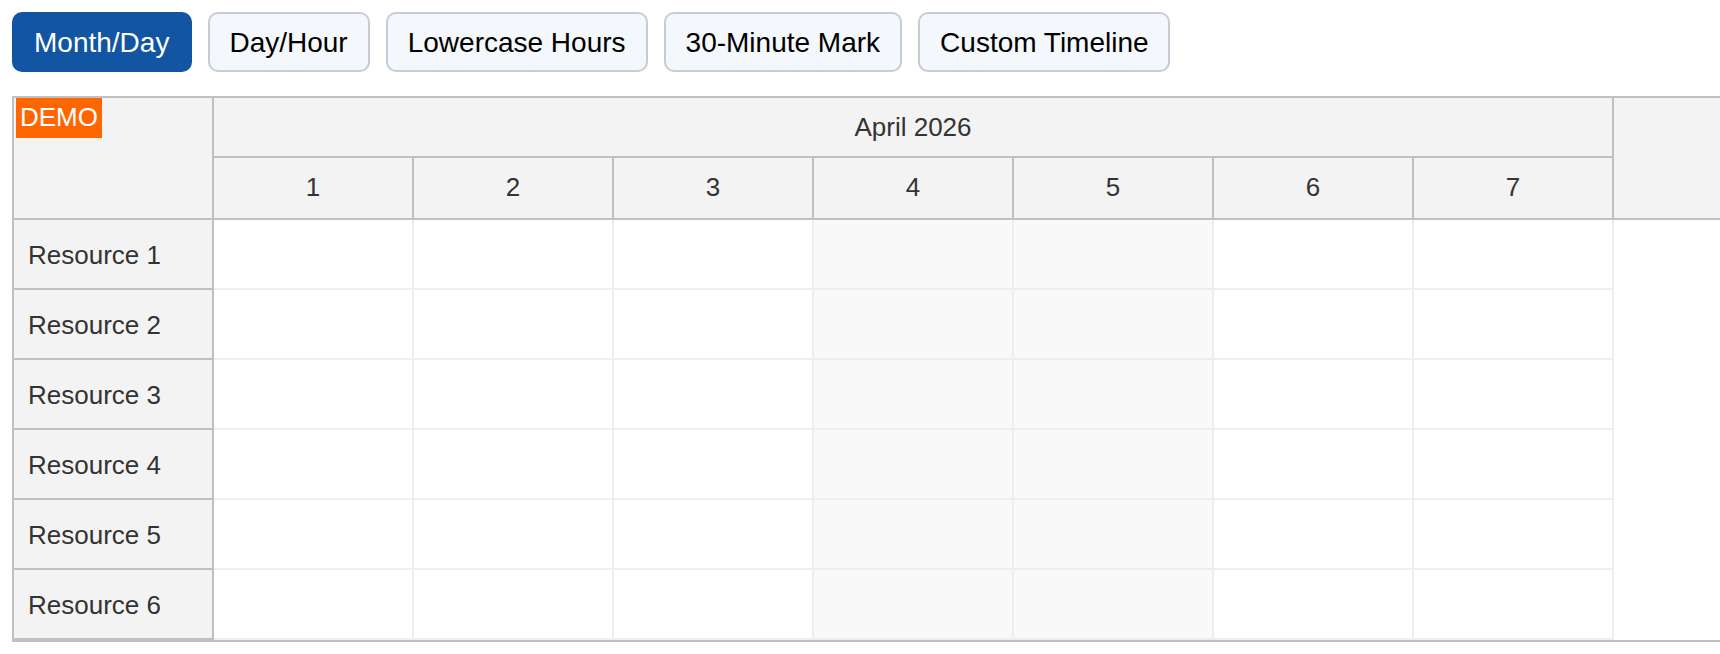
Basic Configuration
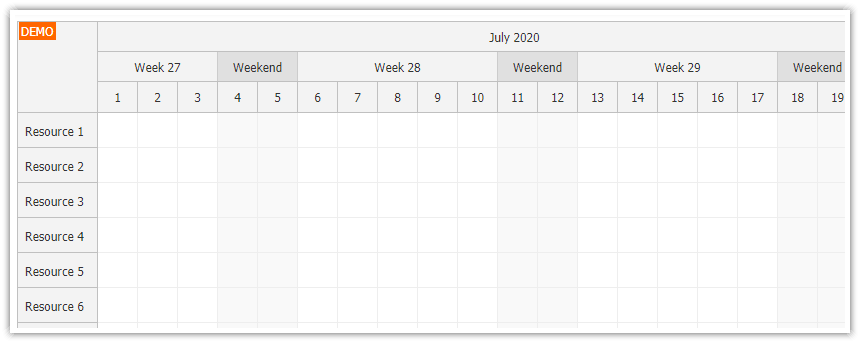
This configuration displays two time header rows grouped by month/day:
{
  scale: "Day",
  cellWidth: 100,
  timeHeaders: [
    { groupBy: "Month" },
    { groupBy: "Day", format: "d" },
  ],
}
You can use the format property to adjust the displayed date. See the available format patterns in the DayPilot.Date.toString() documentation.
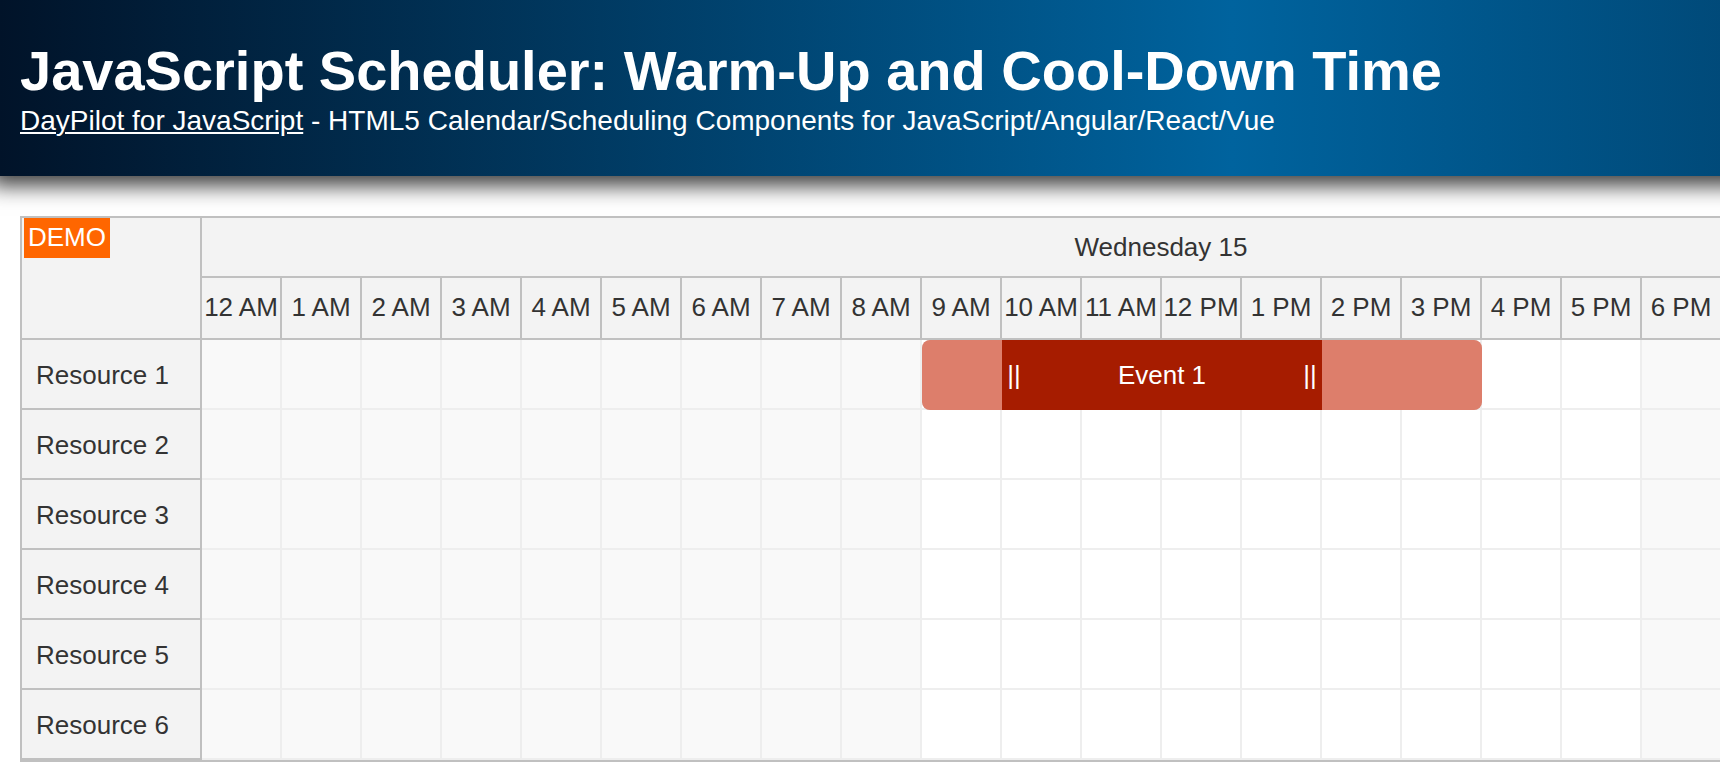
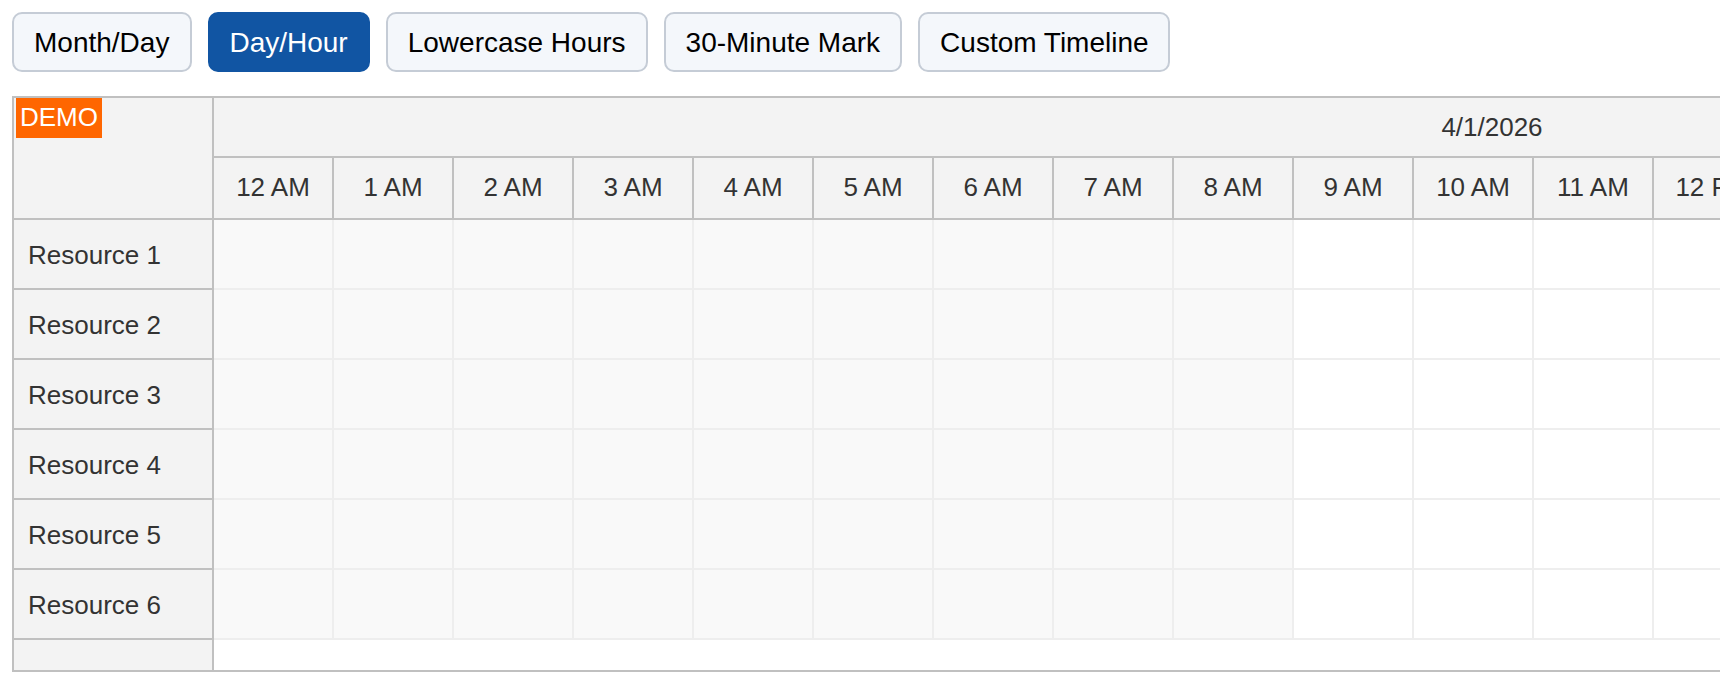
Another configuration uses time headers grouped by day/hour:
{
  scale: "Hour",
  cellWidth: 60,
  timeHeaders: [
    { groupBy: "Day" },
    { groupBy: "Hour" },
  ],
}
For the full list of built-in grouping options, see the documentation:
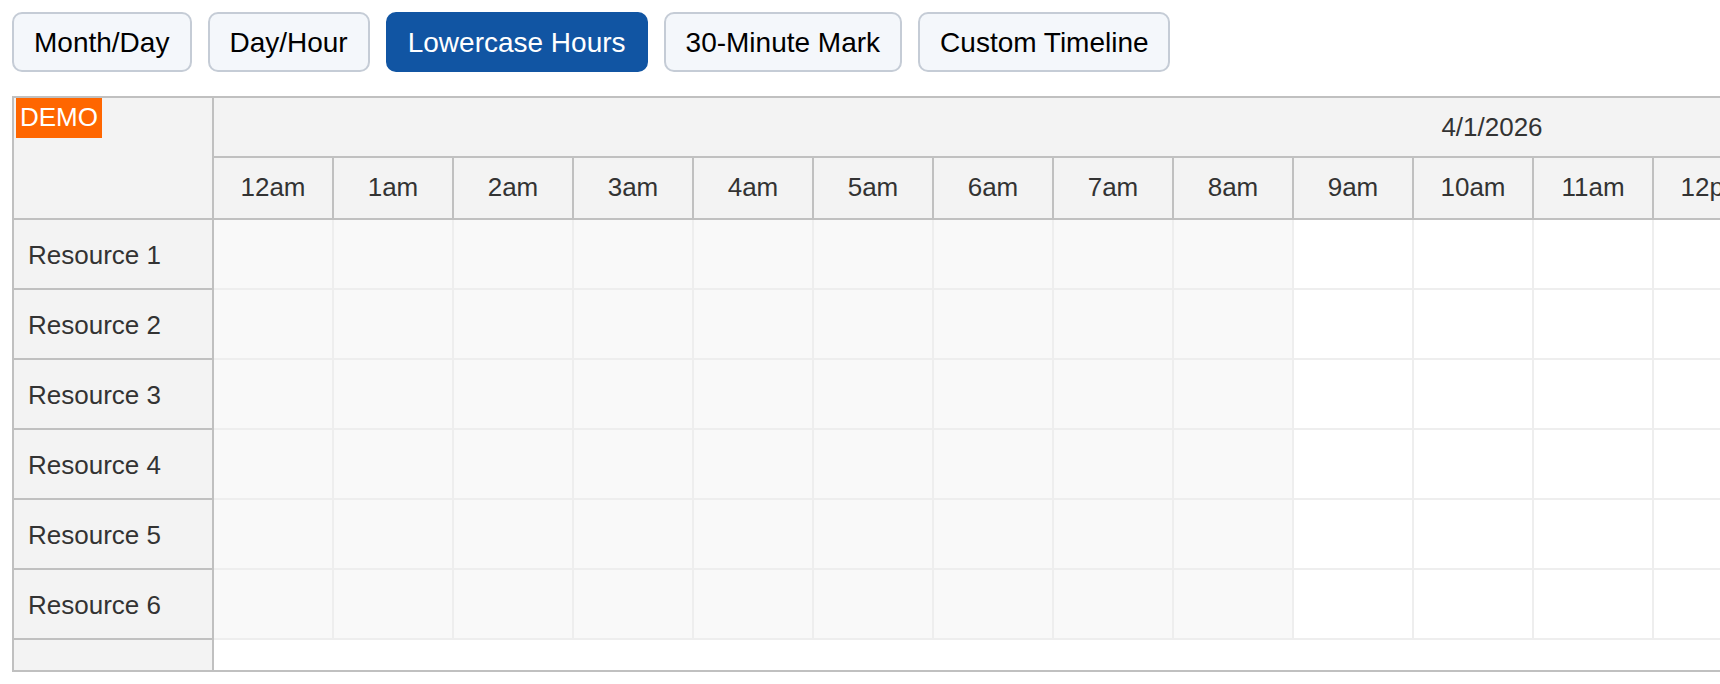
Custom Appearance
If the built-in grouping options are not enough, use onBeforeTimeHeaderRender to customize the content and styling of each time header cell.
The following configuration replaces the default content with a lowercase hour label:
{
scale: "Hour",
cellWidth: 60,
timeHeaders: [
{ groupBy: "Day" },
{ groupBy: "Hour" },
],
onBeforeTimeHeaderRender: (args) => {
if (args.header.level !== 1) {
return;
}
args.header.html = args.header.start.toString("htt").toLowerCase();
},
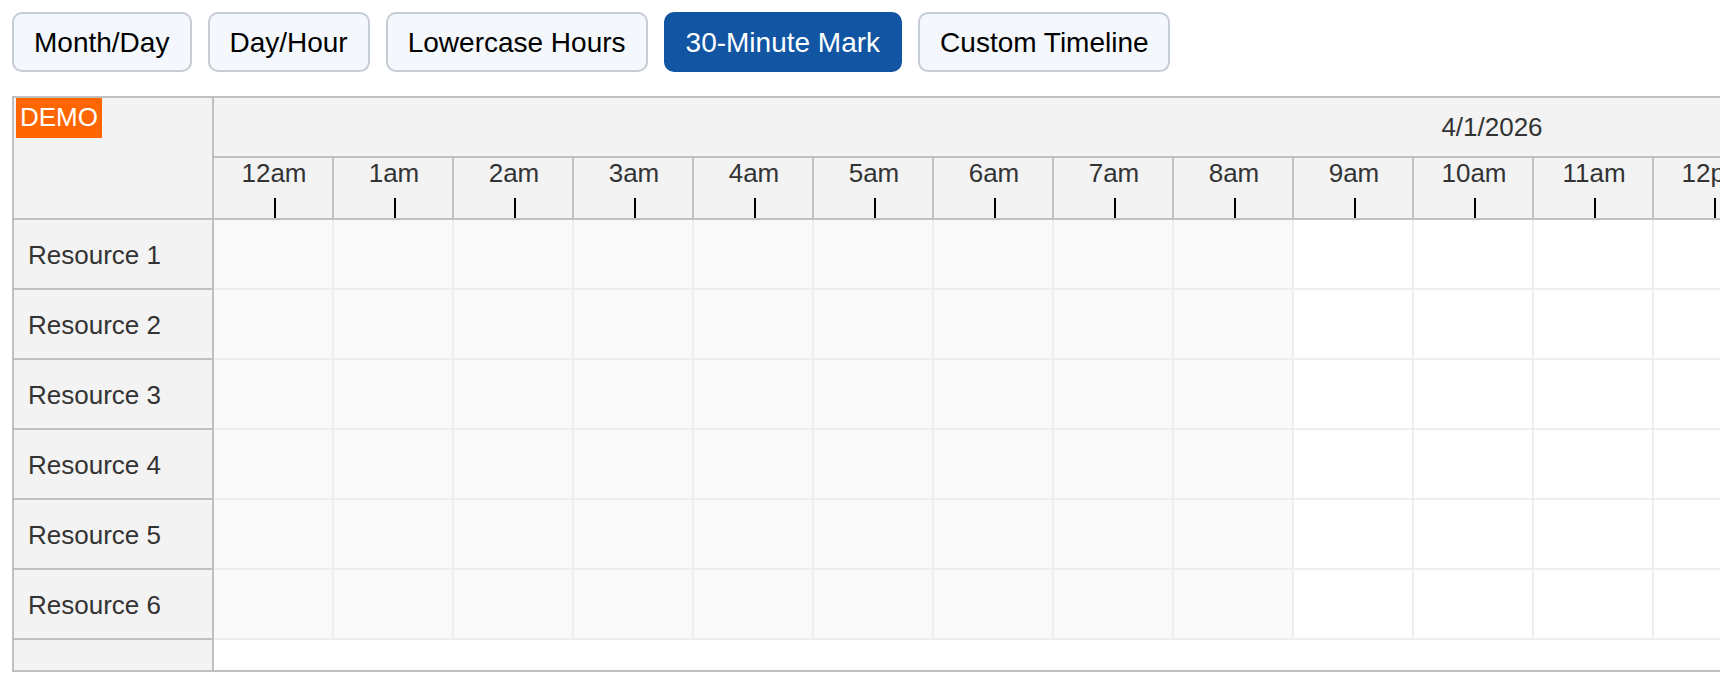
}The next configuration keeps that compact hour label and adds a single separator at the 30-minute position:
{
  scale: "Hour",
  cellWidth: 60,
  timeHeaders: [
    { groupBy: "Day" },
    { groupBy: "Hour", height: 30 },
  ],
  onBeforeTimeHeaderRender: (args) => {
    if (args.header.level !== 1) {
      return;
    }

    args.header.html = "";
    args.header.areas = [
      {
        text: args.header.start.toString("htt").toLowerCase(),
        top: 0,
        height: 20,
        left: 0,
        right: 0,
        horizontalAlignment: "center",
      },
      {
        start: args.header.start.addMinutes(30),
        width: 1,
        top: 20,
        height: 10,
        backColor: "black",
      },
    ];
  },
}
The second time header row is slightly taller because the example sets height: 30 on the hour row.
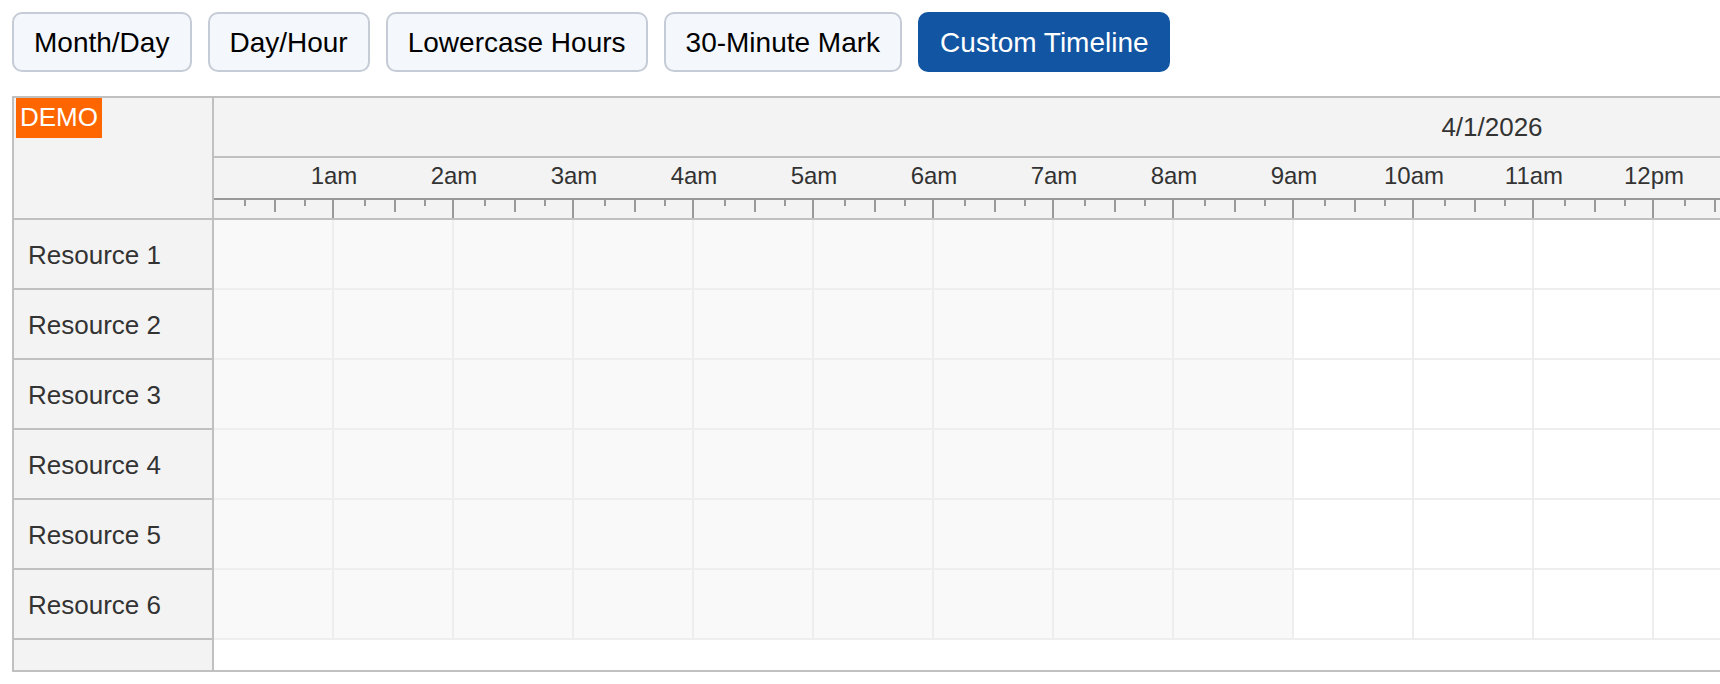
You can use the same technique to draw a completely custom timeline:
{
  scale: "Hour",
  cellWidth: 60,
  timeHeaders: [
    { groupBy: "Day" },
    { groupBy: "Day", height: 30 },
  ],
  onBeforeTimeHeaderRender: (args) => {
    if (args.header.level !== 1) {
      return;
    }

    const color = "#999999";
    const labelHeight = 18;
    const labelStyle = `text-align: center; line-height: ${labelHeight}px; font-size: 12px; white-space: nowrap;`;

    args.header.areas = [];

    for (let hour = 1; hour < 24; hour++) {
      const point = args.header.start.addHours(hour);

      args.header.areas.push({
        start: point.addMinutes(-1),
        width: 1,
        top: 20,
        height: 10,
        backColor: color,
      });

      args.header.areas.push({
        start: point.addMinutes(-30),
        end: point.addMinutes(30),
        top: 0,
        height: labelHeight,
        text: point.toString("htt").toLowerCase(),
        style: labelStyle,
      });
    }

    for (let hour = 0; hour < 24; hour++) {
      const point = args.header.start.addHours(hour);

      args.header.areas.push({
        start: point.addMinutes(15),
        width: 1,
        top: 20,
        height: 4,
        backColor: color,
      });

      args.header.areas.push({
        start: point.addMinutes(30),
        width: 1,
        top: 20,
        height: 7,
        backColor: color,
      });

      args.header.areas.push({
        start: point.addMinutes(45),
        width: 1,
        top: 20,
        height: 4,
        backColor: color,
      });
    }

    args.header.areas.push({
      left: 0,
      right: 0,
      top: 20,
      height: 1,
      backColor: color,
    });

    args.header.html = "";
  },
}
In this mode, both header rows use groupBy: "Day". The original HTML is disabled by setting args.header.html = "", and the complete timeline is drawn using active areas positioned by time.
The hour labels use an 18-pixel-high active area with a matching line-height, which keeps the text fully visible in the 30-pixel header row.
History
April 9, 2026: Refreshed the sample using the latest DayPilot Pro for JavaScript, updated the code to modern JavaScript, and added an example switcher so all configurations shown in the tutorial are available in the sample project.