Overview
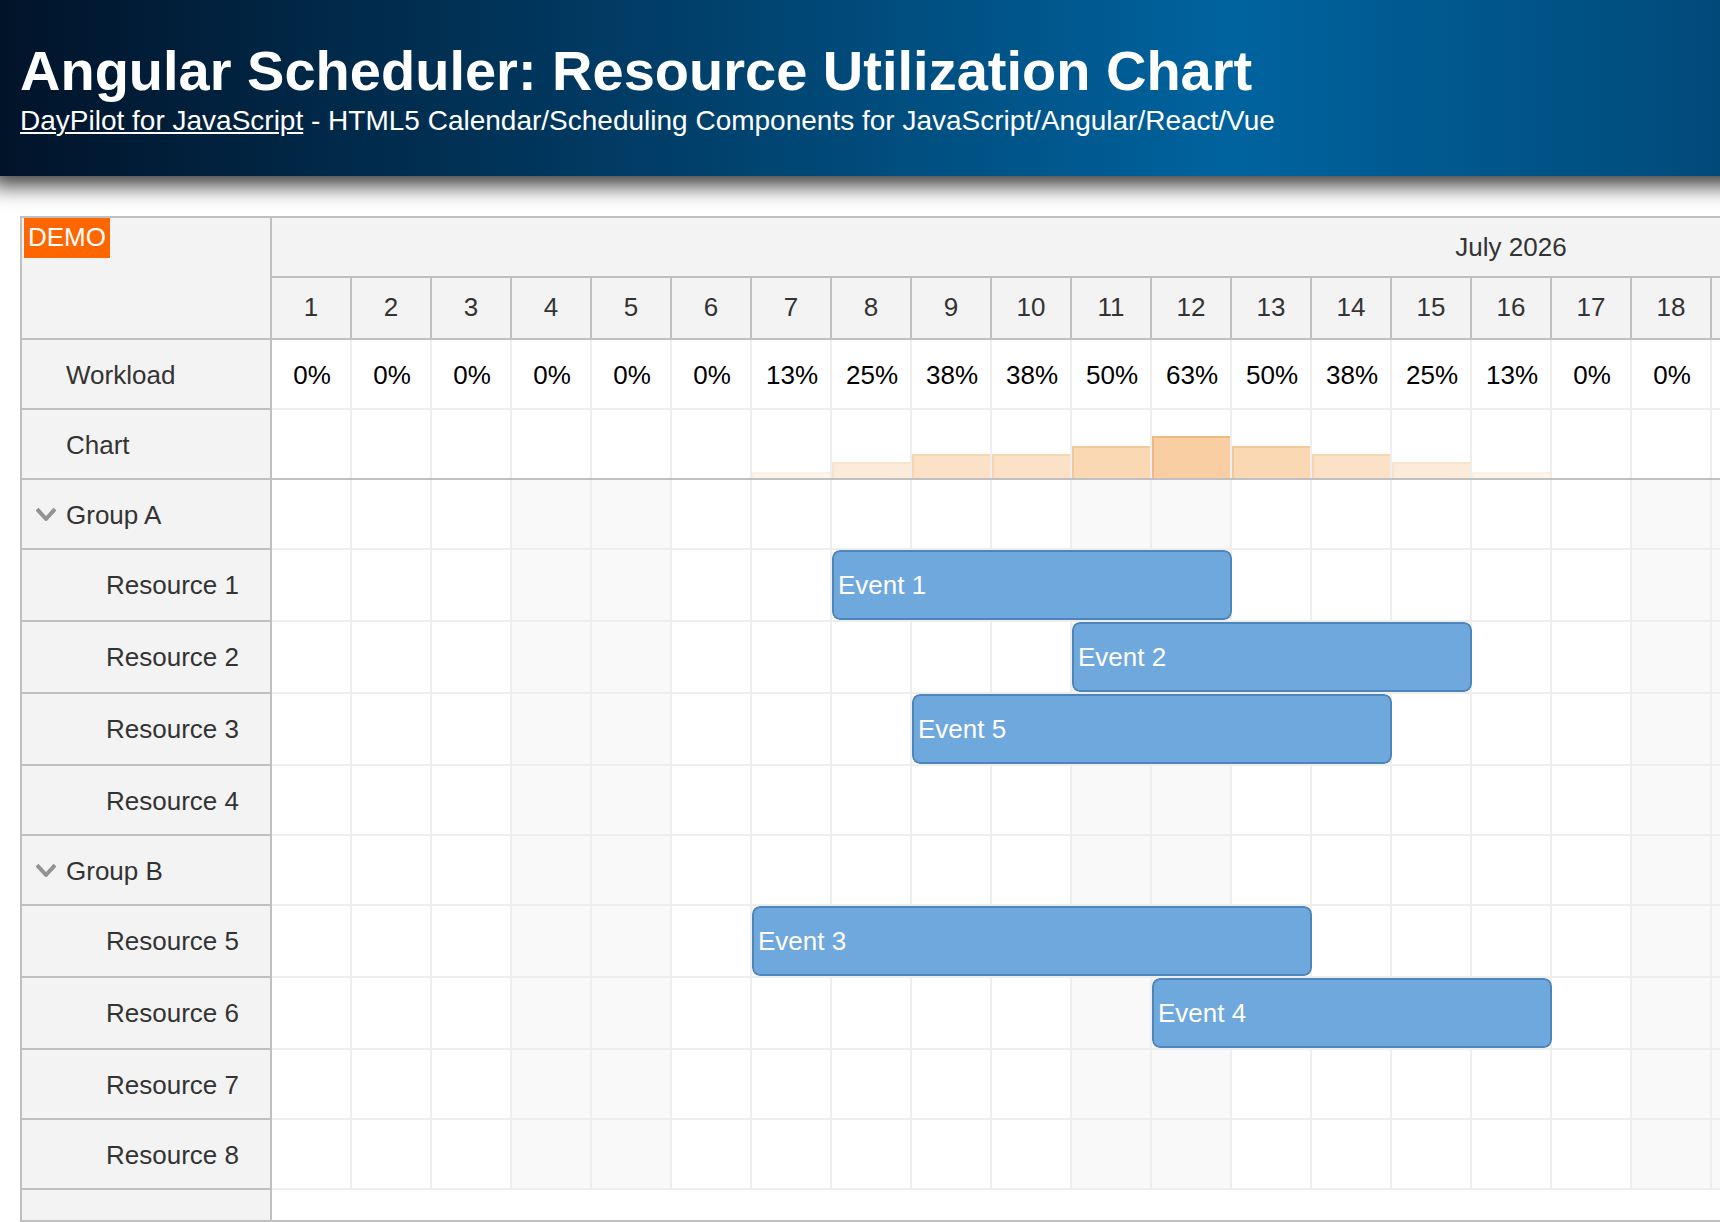
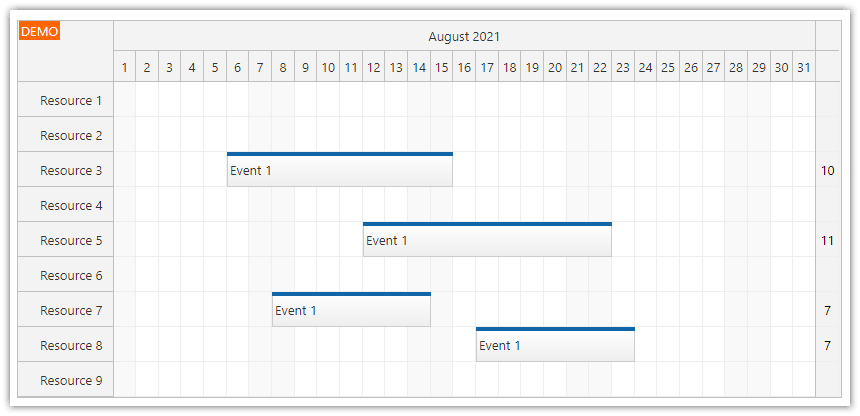
A frozen row at the top of the Scheduler displays the number of events planned for each day.
A frozen row at the bottom displays the same utilization graphically using a red bar chart.
The downloadable sample uses the current JavaScript Scheduler Builder template and includes a trial version of DayPilot Pro for JavaScript.
License
Licensed for testing and evaluation purposes. Please see LICENSE.md in the sample project. You can use the source code of the tutorial if you are a licensed user of DayPilot Pro for JavaScript.
Resource Utilization Row
This sample project shows how to calculate resource utilization for a particular time column (a day in this case) in the JavaScript Scheduler component.
The following screenshot shows the source data for the column summary. In the refreshed sample, 7 resources contain a scheduled event on April 12, 2026:

We can calculate the total for each day and display it in the Summary row:

First, define the extra frozen row. In the refreshed Builder-style sample, the rows are created inside app.init() and applied using dp.update(). We place the summary row at the top, enable automatic cell updates, and disable direct interaction in that row:
const resources = [
  { name: "Summary", id: "summary", frozen: "top", cellsAutoUpdated: true, cellsDisabled: true },
  { name: "Resource 1", id: "R1" },
  { name: "Resource 2", id: "R2" },
  { name: "Resource 3", id: "R3" },
  { name: "Resource 4", id: "R4" },
  { name: "Resource 5", id: "R5" },
  { name: "Resource 6", id: "R6" },
  { name: "Resource 7", id: "R7" },
  { name: "Resource 8", id: "R8" },
  { name: "Resource 9", id: "R9" },
  { name: "Availability", id: "availability", frozen: "bottom", cellsAutoUpdated: true, cellsDisabled: true },
];
The summary rows use automatic cell updates (cellsAutoUpdated) so the calculated values refresh after every data change. Without that flag, the result of onBeforeCellRender would be cached and reused.
The value is calculated inside the onBeforeCellRender event handler, which is called for every visible Scheduler cell.
First, count the events that overlap the current day:
const eventCount = dp.events.forRange(args.cell.start, args.cell.end).length;The events.forRange() method returns all events that overlap the specified cell time range.
Now we can center the number in the summary cell using a full-size active area:
if (args.cell.resource === "summary") {
  args.cell.areas = [
    {
      left: 0,
      top: 0,
      right: 0,
      bottom: 0,
      style: "display:flex;justify-content:center;align-items:center;font-weight:700;color:#0b3558;",
      text: String(eventCount),
    },
  ];
  return;
}
Availability Chart Row

We can use the same calculation to display the utilization graphically in a frozen row at the bottom of the Scheduler grid.
The extra bottom row is defined using frozen: "bottom":
{ name: "Availability", id: "availability", frozen: "bottom", cellsAutoUpdated: true, cellsDisabled: true }This time, we extend onBeforeCellRender and add a red bar that grows with the fraction of occupied resources.
First, calculate the utilization for the current day:
const resources = dp.rows.all().filter((row) => !row.data.frozen && !row.children().length);
const resourceCount = resources.length || 1;
const utilization = Math.min(eventCount / resourceCount, 1);
const maxHeight = dp.eventHeight || 35;
const height = utilization * maxHeight;
Then create a bottom-aligned active area. The bar height and opacity both reflect the utilization percentage:
if (args.cell.resource === "availability") {
  if (eventCount === 0) {
    return;
  }

  args.cell.areas = [
    {
      bottom: 0,
      height,
      left: 0,
      right: 0,
      backColor: "#cc0000",
      style: "opacity: " + utilization,
    },
  ];
}
Full Source Code
And here is the full source code of the refreshed sample that shows a Scheduler with a frozen summary row above the main grid and a frozen availability chart row below it:
<!DOCTYPE html>
<html>
<head>
  <meta charset="utf-8"/>
  <meta name="viewport" content="width=device-width, initial-scale=1">
  <title>JavaScript Scheduler: Column Summary and Availability Chart</title>

  <style type="text/css">
    p, body, td, input, select, button { font-family: -apple-system,system-ui,BlinkMacSystemFont,'Segoe UI',Roboto,'Helvetica Neue',Arial,sans-serif; font-size: 14px; }
    body { padding: 0; margin: 0; background-color: #ffffff; }
    a { color: #1155a3; }
    .space { margin: 10px 0; }
    .header { background: #003267; background: linear-gradient(to right, #011329 0%,#00639e 44%,#011329 100%); padding:20px 10px; color: white; box-shadow: 0 0 10px 5px rgba(0,0,0,0.75); }
    .header a { color: white; }
    .header h1 a { text-decoration: none; }
    .header h1 { padding: 0; margin: 0; }
    .main { padding: 10px; margin-top: 10px; }
    .generated { color: #999; }
    .generated a { color: #999; }
  </style>

  <!-- DayPilot library -->
  <script src="js/daypilot/daypilot-all.min.js"></script>
</head>
<body>
<div class="header">
  <h1><a href='https://code.daypilot.org/93064/javascript-scheduler-column-summary'>JavaScript Scheduler: Column Summary and Availability Chart</a></h1>
  <div><a href="https://javascript.daypilot.org/">DayPilot for JavaScript</a> - HTML5 Calendar/Scheduling Components for JavaScript/Angular/React/Vue</div>
</div>

<div class="main">
  <div id="dp"></div>
  <div class="generated">Generated using <a href="https://builder.daypilot.org/">DayPilot UI Builder</a>.</div>
</div>

<script>
  const dp = new DayPilot.Scheduler("dp", {
    eventClickHandling: "Disabled",
    timeRangeSelectedHandling: "Enabled",
    onTimeRangeSelected: async (args) => {
      const scheduler = args.control;
      const modal = await DayPilot.Modal.prompt("Create a new event:", "Event 1");
      scheduler.clearSelection();
      if (modal.canceled) { return; }
      scheduler.events.add({
        start: args.start,
        end: args.end,
        id: DayPilot.guid(),
        resource: args.resource,
        text: modal.result,
      });
    },
    eventDeleteHandling: "Update",
    onEventDeleted: (args) => {
      console.log("Event deleted: " + args.e.text());
    },
    eventHoverHandling: "Bubble",
    bubble: new DayPilot.Bubble({
      onLoad: (args) => {
        args.html = "Event details";
      }
    }),
    eventMoveHandling: "Update",
    onEventMoved: (args) => {
      console.log("Event moved: " + args.e.text());
    },
    eventResizeHandling: "Update",
    onEventResized: (args) => {
      console.log("Event resized: " + args.e.text());
    },
    days: DayPilot.Date.today().daysInMonth(),
    startDate: DayPilot.Date.today().firstDayOfMonth(),
    treeEnabled: true,
    scale: "Day",
    timeHeaders: [{ groupBy: "Month" }, { format: "d", groupBy: "Day" }],
    onBeforeCellRender: (args) => {
      if (args.cell.resource !== "summary" && args.cell.resource !== "availability") {
        return;
      }

      const resources = dp.rows.all().filter((row) => !row.data.frozen && !row.children().length);
      const resourceCount = resources.length || 1;
      const eventCount = dp.events.forRange(args.cell.start, args.cell.end).length;

      args.cell.backColor = "#ffffff";

      if (args.cell.resource === "summary") {
        args.cell.areas = [
          {
            left: 0,
            top: 0,
            right: 0,
            bottom: 0,
            style: "display:flex;justify-content:center;align-items:center;font-weight:700;color:#0b3558;",
            text: String(eventCount),
          },
        ];
        return;
      }

      if (eventCount === 0) {
        return;
      }

      const utilization = Math.min(eventCount / resourceCount, 1);
      const maxHeight = dp.eventHeight || 35;
      const height = utilization * maxHeight;

      args.cell.areas = [
        {
          bottom: 0,
          height,
          left: 0,
          right: 0,
          backColor: "#cc0000",
          style: "opacity: " + utilization,
        },
      ];
    },
  });
  dp.init();

  const app = {
    init() {
      const startDate = DayPilot.Date.today().firstDayOfMonth();
      const resources = [
        { name: "Summary", id: "summary", frozen: "top", cellsAutoUpdated: true, cellsDisabled: true },
        { name: "Resource 1", id: "R1" },
        { name: "Resource 2", id: "R2" },
        { name: "Resource 3", id: "R3" },
        { name: "Resource 4", id: "R4" },
        { name: "Resource 5", id: "R5" },
        { name: "Resource 6", id: "R6" },
        { name: "Resource 7", id: "R7" },
        { name: "Resource 8", id: "R8" },
        { name: "Resource 9", id: "R9" },
        { name: "Availability", id: "availability", frozen: "bottom", cellsAutoUpdated: true, cellsDisabled: true },
      ];
      const events = [
        { start: startDate.addDays(6), end: startDate.addDays(14), id: "event-1", resource: "R3", text: "Event 1" },
        { start: startDate.addDays(9), end: startDate.addDays(18), id: "event-2", resource: "R4", text: "Event 2" },
        { start: startDate.addDays(7), end: startDate.addDays(12), id: "event-3", resource: "R7", text: "Event 3" },
        { start: startDate.addDays(10), end: startDate.addDays(16), id: "event-4", resource: "R8", text: "Event 4" },
        { start: startDate.addDays(8), end: startDate.addDays(14), id: "event-5", resource: "R5", text: "Event 5" },
        { start: startDate.addDays(9), end: startDate.addDays(14), id: "event-6", resource: "R6", text: "Event 6" },
        { start: startDate.addDays(8), end: startDate.addDays(14), id: "event-7", resource: "R2", text: "Event 7" },
      ];

      dp.update({
        startDate,
        days: startDate.daysInMonth(),
        resources,
        events,
      });
    },
  };
  app.init();
</script>

</body>
</html>
History
April 20, 2026: Refreshed to the current JavaScript Scheduler Builder template and DayPilot Pro for JavaScript 2026.2.6907; updated the sample to modern JavaScript.